29
/
en
AIzaSyAYiBZKx7MnpbEhh9jyipgxe19OcubqV5w
April 1, 2024
40916
Late-demographic dividend
LTE
false
2
1
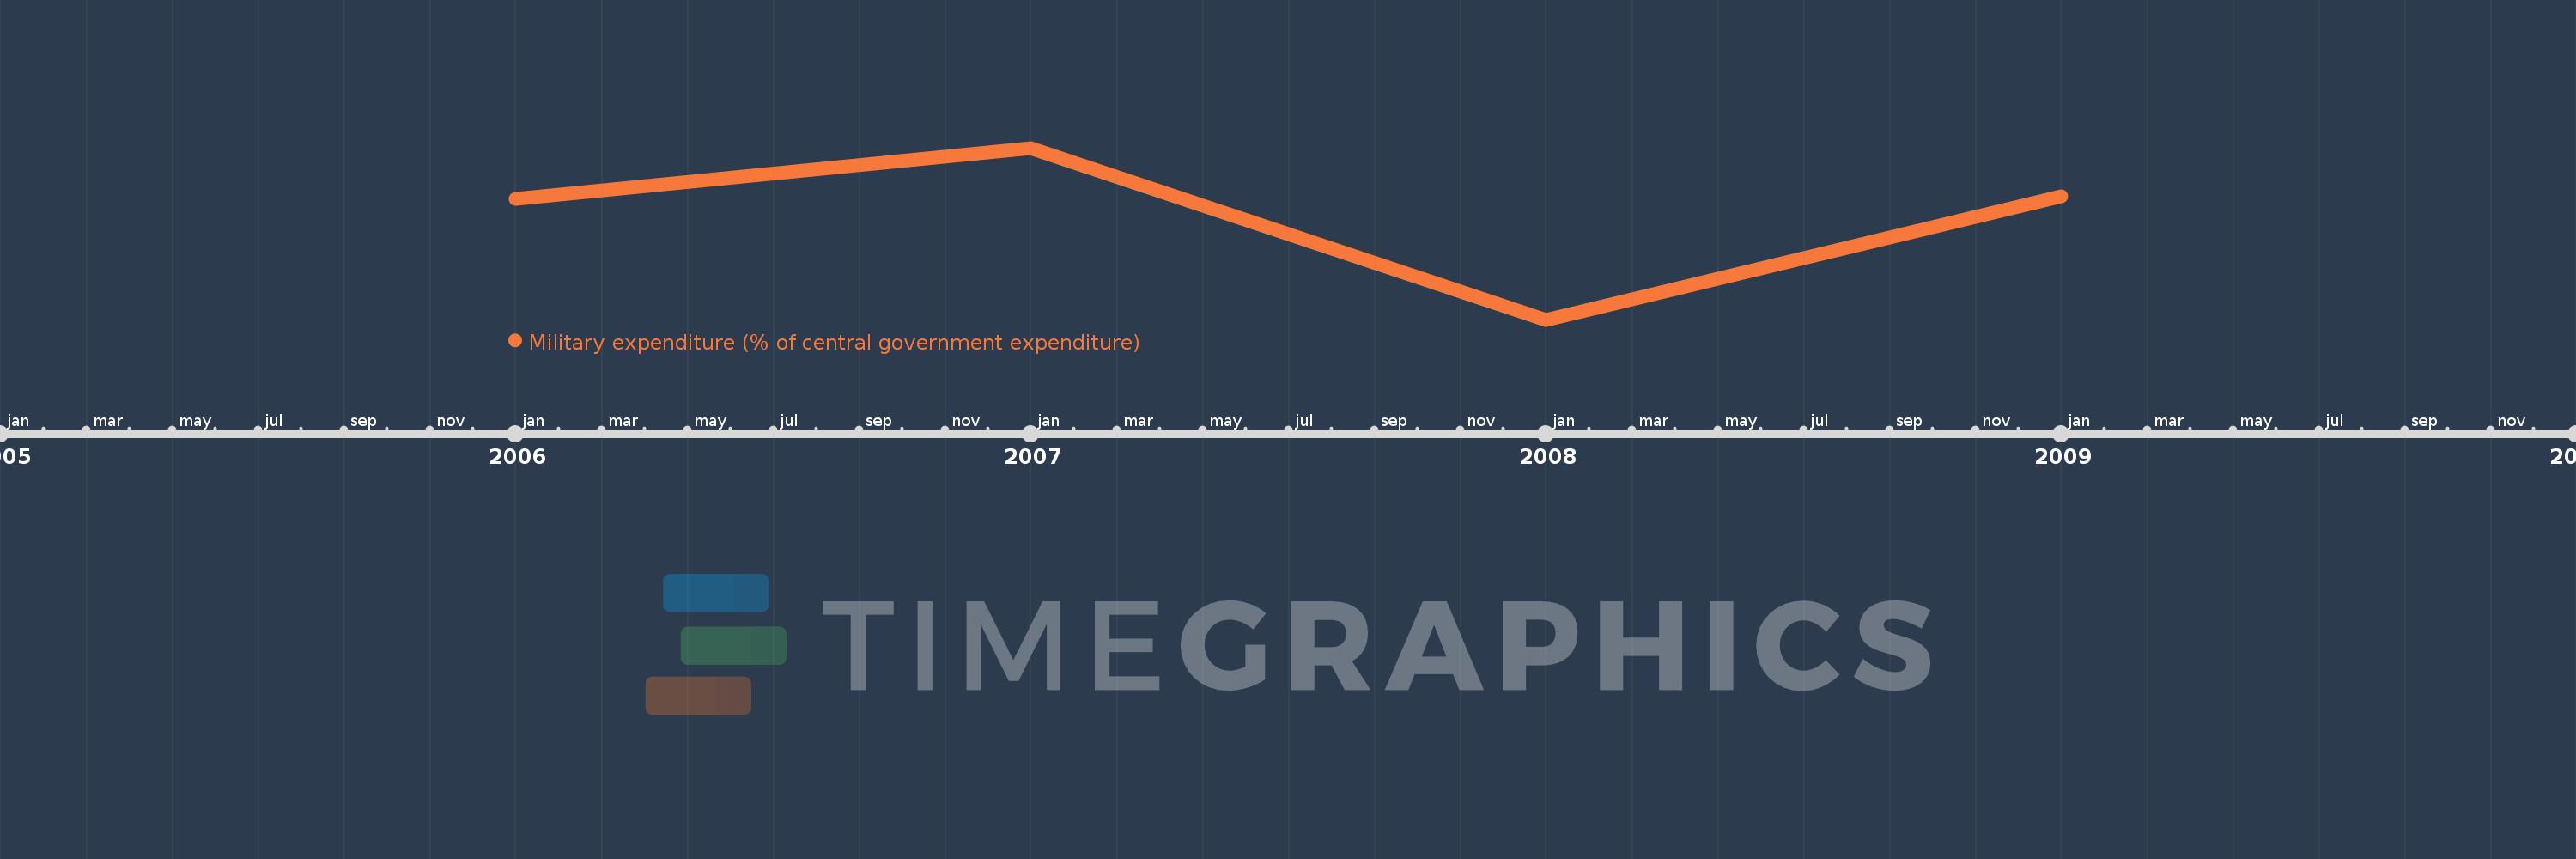
Military expenditure (% of central government expenditure)
2009,2008,2007,2006
This statistics in other country:
Timeline:
This timeline shows a graph from 2006 to 2009 of Late-demographic dividend. No data until 2005. Number of actual observations by date: 4.
Source name:
World Development Indicators
Source organization:
Stockholm International Peace Research Institute (SIPRI), Yearbook: Armaments, Disarmament and International Security.
Categories, topics:
Public Sector
Last updated:
apr 23, 2017
Indicators value changes by year
Maximum:
12.674
jan 1, 2007
At the date of observation
Value
Absolute change
Change from previous value
jan 1, 2006
11.867
+11.867
0.0%
jan 1, 2007
12.674
+0.807
6.8%
jan 1, 2008
9.94
-2.734
-21.57%
jan 1, 2009
11.907
+1.967
19.79%
Ranking of countries by current statistics by years


Comments: