29
/
en
AIzaSyAYiBZKx7MnpbEhh9jyipgxe19OcubqV5w
April 1, 2024
68016
Angola
AGO
true
2
1
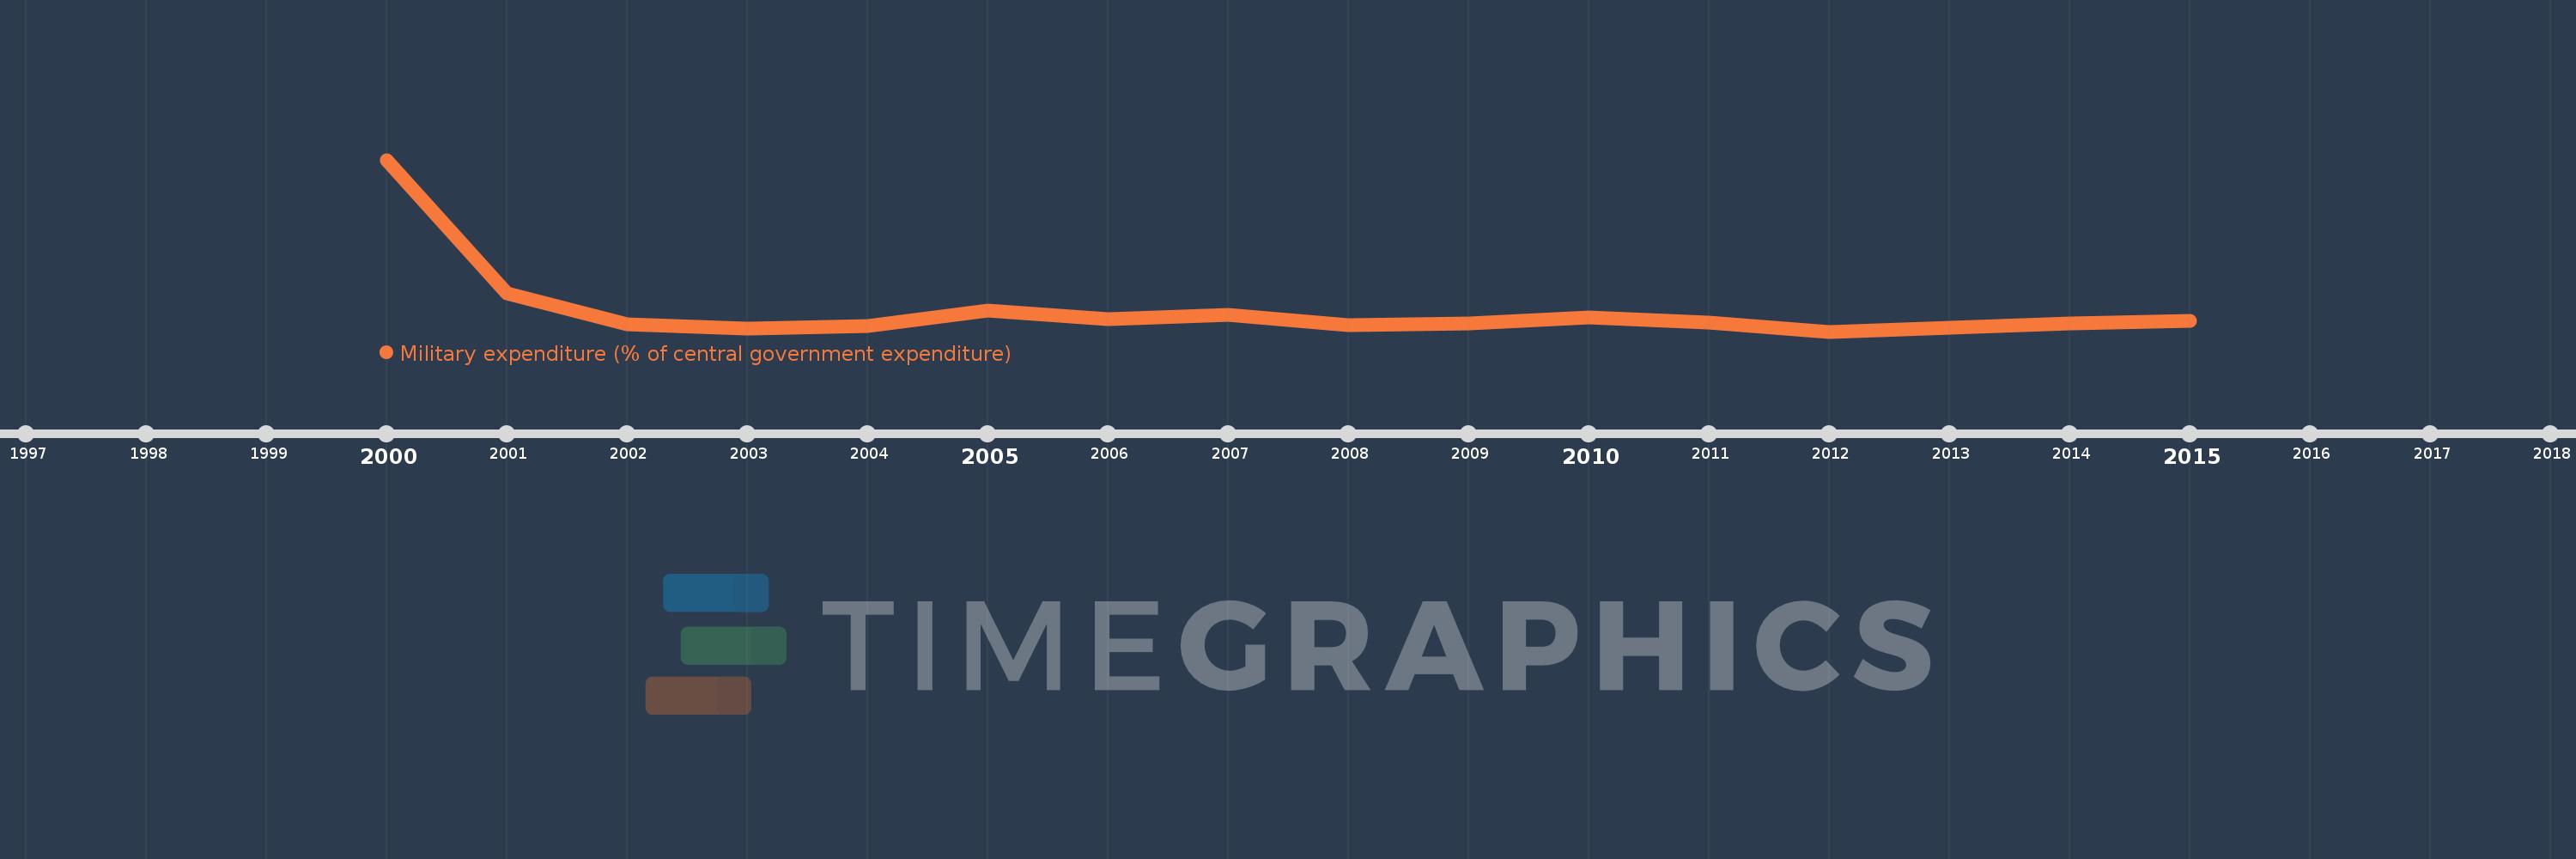
Military expenditure (% of central government expenditure)
2015,2014,2013,2012,2011,2010,2009,2008,2007,2006,2005,2004,2003,2002,2001,2000
This statistics in other country:
Timeline:
This timeline shows a graph from 2000 to 2015 of Angola. No data until 1999. Number of actual observations by date: 16.
Source name:
World Development Indicators
Source organization:
Stockholm International Peace Research Institute (SIPRI), Yearbook: Armaments, Disarmament and International Security.
Categories, topics:
Public Sector
Last updated:
apr 23, 2017
Indicators value changes by year
Minimum:
12.207
jan 1, 2012
Maximum:
88.206
jan 1, 2000
At the date of observation
Value
Absolute change
Change from previous value
jan 1, 2000
88.206
+88.206
0.0%
jan 1, 2001
29.284
-58.923
-66.8%
jan 1, 2002
15.593
-13.691
-46.75%
jan 1, 2003
13.587
-2.006
-12.86%
jan 1, 2004
14.521
+0.934
6.88%
jan 1, 2005
21.499
+6.978
48.06%
jan 1, 2006
17.729
-3.77
-17.54%
jan 1, 2007
19.763
+2.034
11.47%
jan 1, 2008
14.955
-4.809
-24.33%
jan 1, 2009
15.962
+1.007
6.73%
jan 1, 2010
18.469
+2.507
15.71%
jan 1, 2011
16.287
-2.181
-11.81%
jan 1, 2012
12.207
-4.081
-25.05%
jan 1, 2013
13.802
+1.596
13.07%
jan 1, 2014
15.794
+1.991
14.43%
jan 1, 2015
16.8
+1.006
6.37%
Ranking of countries by current statistics by years


Comments: