29
/
en
AIzaSyAYiBZKx7MnpbEhh9jyipgxe19OcubqV5w
April 1, 2024
48332
Middle East & North Africa
MEA
false
2
1
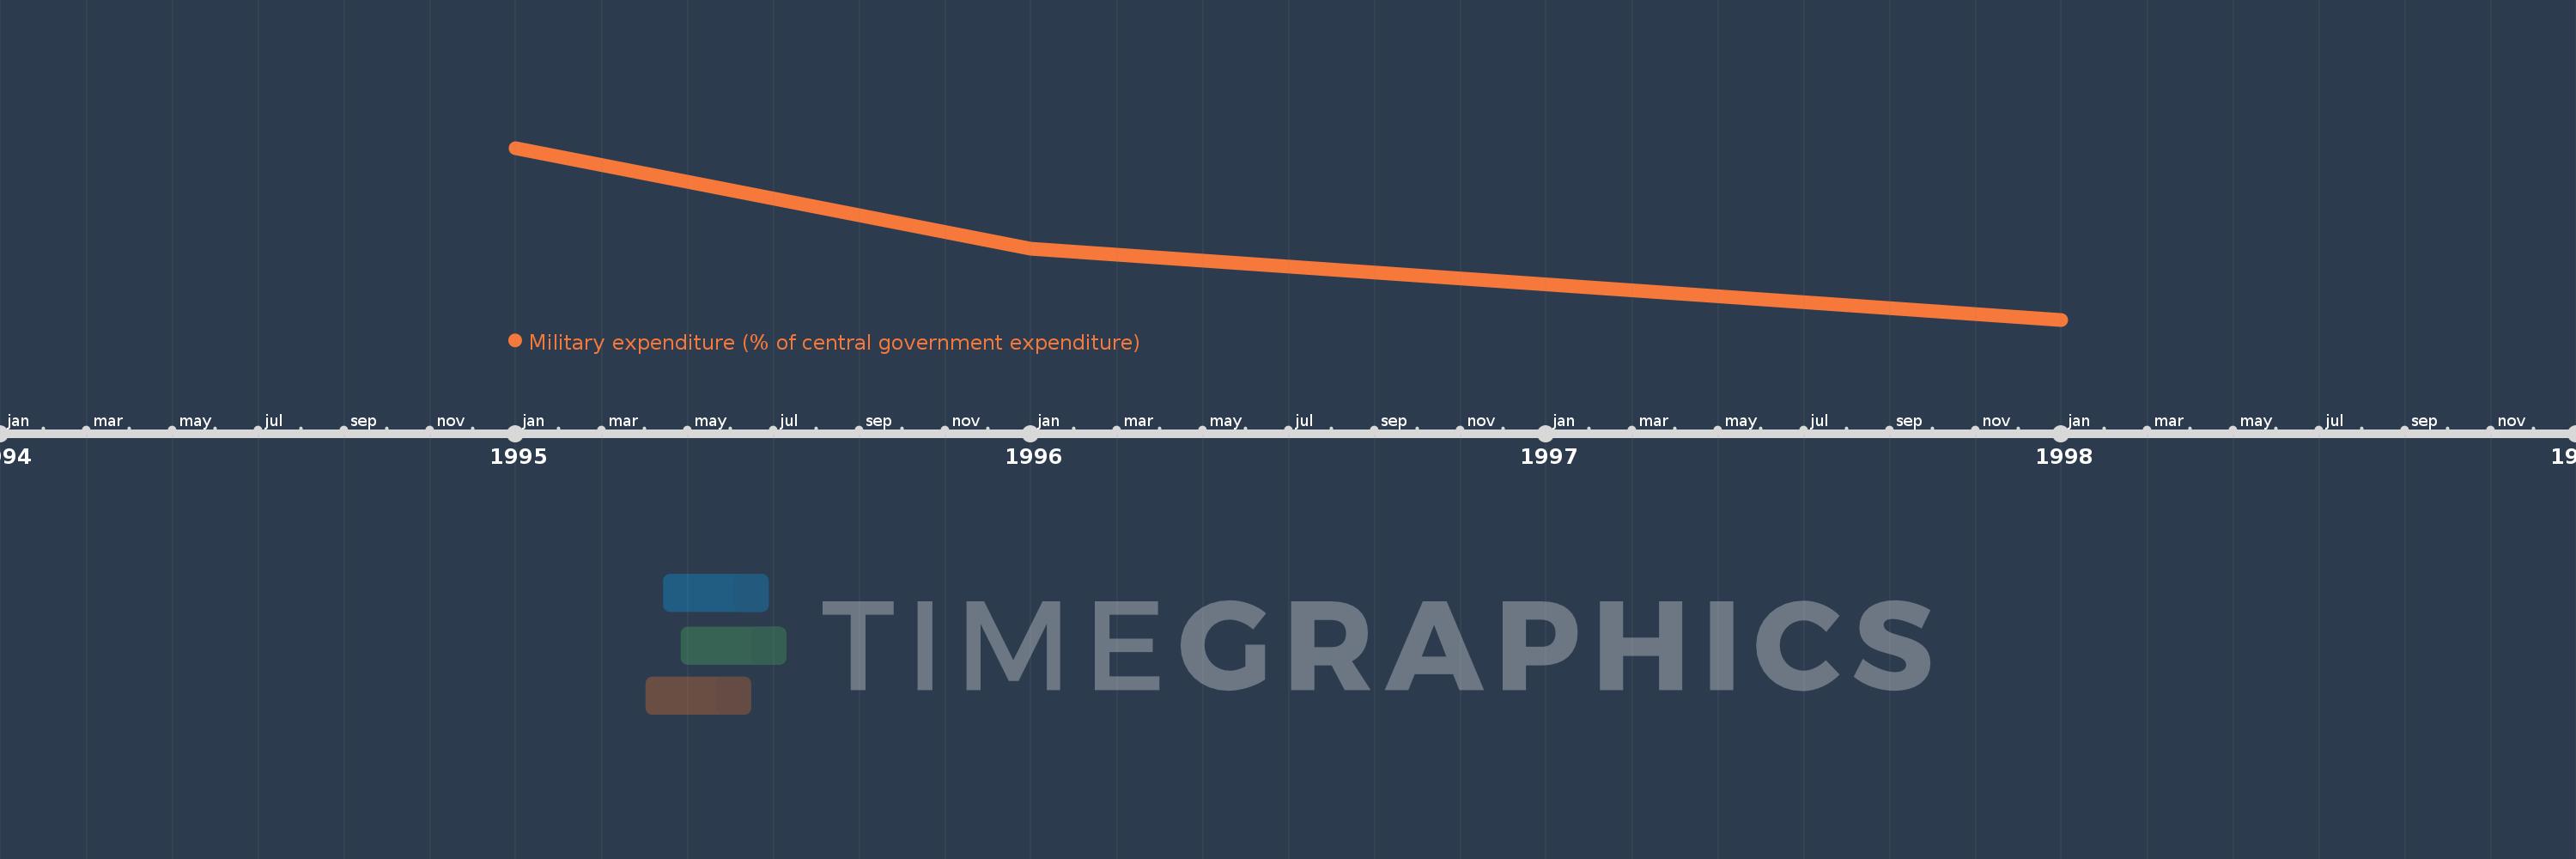
Military expenditure (% of central government expenditure)
1998,1996,1995
This statistics in other country:
Timeline:
This timeline shows a graph from 1995 to 1998 of Middle East & North Africa. No data until 1994. Number of actual observations by date: 3.
Source name:
World Development Indicators
Source organization:
Stockholm International Peace Research Institute (SIPRI), Yearbook: Armaments, Disarmament and International Security.
Categories, topics:
Public Sector
Last updated:
apr 23, 2017
Indicators value changes by year
Minimum:
18.594
jan 1, 1998
Maximum:
20.703
jan 1, 1995
At the date of observation
Value
Absolute change
Change from previous value
jan 1, 1995
20.703
+20.703
0.0%
jan 1, 1996
19.465
-1.239
-5.98%
jan 1, 1998
18.594
-0.87
-4.47%
Ranking of countries by current statistics by years


Comments: