29
/
en
AIzaSyAYiBZKx7MnpbEhh9jyipgxe19OcubqV5w
April 1, 2024
31840
Europe & Central Asia (excluding high income)
ECA
false
2
1
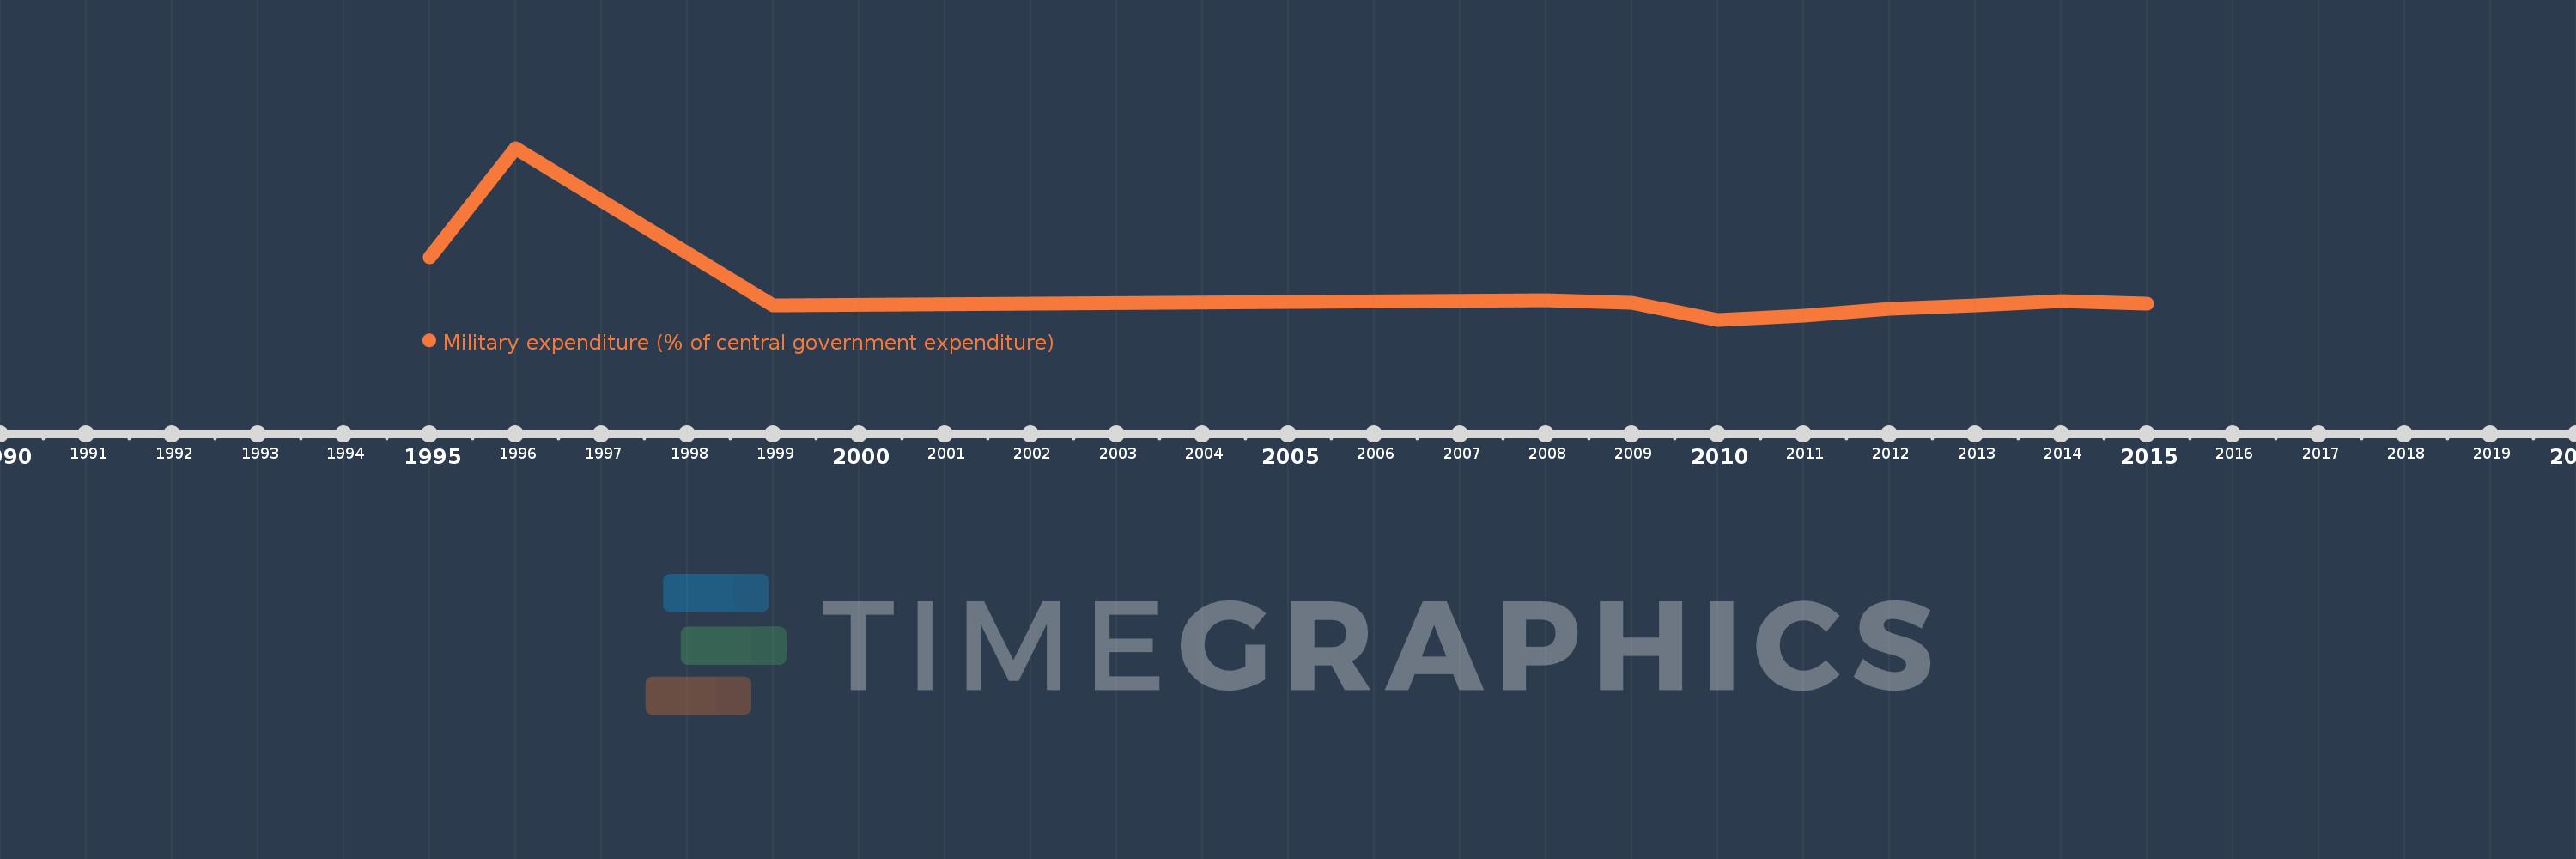
Military expenditure (% of central government expenditure)
2015,2014,2013,2012,2011,2010,2009,2008,1999,1996,1995
This statistics in other country:
Timeline:
This timeline shows a graph from 1995 to 2015 of Europe & Central Asia (excluding high income). No data until 1994. Number of actual observations by date: 11.
Source name:
World Development Indicators
Source organization:
Stockholm International Peace Research Institute (SIPRI), Yearbook: Armaments, Disarmament and International Security.
Categories, topics:
Public Sector
Last updated:
apr 23, 2017
Indicators value changes by year
Minimum:
10.391
jan 1, 2010
Maximum:
29.449
jan 1, 1996
At the date of observation
Value
Absolute change
Change from previous value
jan 1, 1995
17.295
+17.295
0.0%
jan 1, 1996
29.449
+12.155
70.28%
jan 1, 1999
11.988
-17.461
-59.29%
jan 1, 2008
12.53
+0.542
4.52%
jan 1, 2009
12.223
-0.307
-2.45%
jan 1, 2010
10.391
-1.833
-14.99%
jan 1, 2011
10.793
+0.402
3.87%
jan 1, 2012
11.598
+0.806
7.47%
jan 1, 2013
11.95
+0.351
3.03%
jan 1, 2014
12.487
+0.537
4.5%
jan 1, 2015
12.208
-0.279
-2.23%
Ranking of countries by current statistics by years


Comments: