29
/
en
AIzaSyAYiBZKx7MnpbEhh9jyipgxe19OcubqV5w
April 1, 2024
52831
OECD members
OED
false
2
1
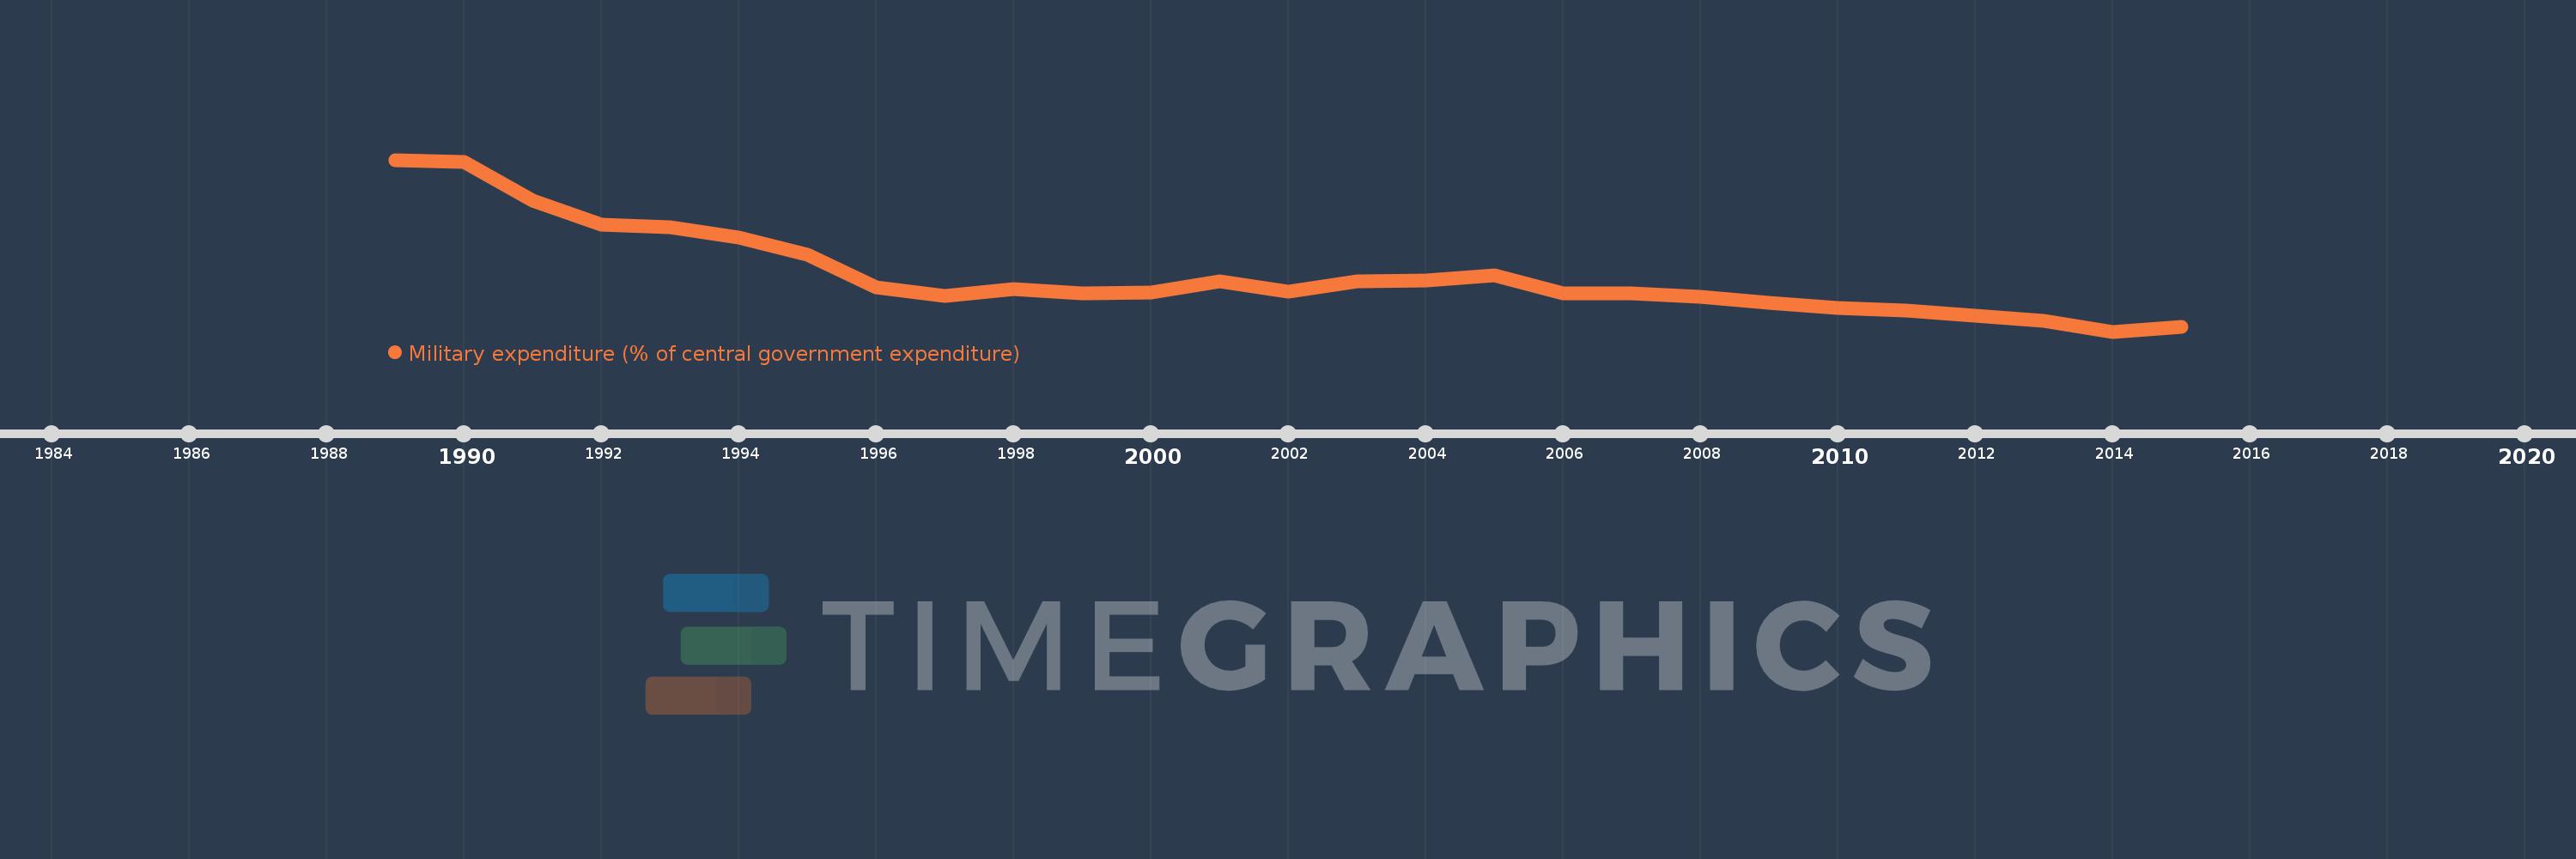
Military expenditure (% of central government expenditure)
2015,2014,2013,2012,2011,2010,2009,2008,2007,2006,2005,2004,2003,2002,2001,2000,1999,1998,1997,1996,1995,1994,1993,1992,1991,1990,1989
This statistics in other country:
Timeline:
This timeline shows a graph from 1989 to 2015 of OECD members. No data until 1988. Number of actual observations by date: 27.
Source name:
World Development Indicators
Source organization:
Stockholm International Peace Research Institute (SIPRI), Yearbook: Armaments, Disarmament and International Security.
Categories, topics:
Public Sector
Last updated:
apr 23, 2017
Indicators value changes by year
Maximum:
14.477
jan 1, 1989
At the date of observation
Value
Absolute change
Change from previous value
jan 1, 1989
14.477
+14.477
0.0%
jan 1, 1990
14.411
-0.066
-0.46%
jan 1, 1991
13.038
-1.373
-9.53%
jan 1, 1992
12.179
-0.858
-6.58%
jan 1, 1993
12.082
-0.097
-0.8%
jan 1, 1994
11.714
-0.368
-3.04%
jan 1, 1995
11.101
-0.613
-5.24%
jan 1, 1996
9.943
-1.158
-10.43%
jan 1, 1997
9.626
-0.316
-3.18%
jan 1, 1998
9.883
+0.257
2.67%
jan 1, 1999
9.716
-0.167
-1.69%
jan 1, 2000
9.754
+0.038
0.39%
jan 1, 2001
10.141
+0.387
3.97%
jan 1, 2002
9.778
-0.364
-3.59%
jan 1, 2003
10.145
+0.368
3.76%
jan 1, 2004
10.185
+0.039
0.39%
jan 1, 2005
10.35
+0.165
1.62%
jan 1, 2006
9.726
-0.624
-6.02%
jan 1, 2007
9.729
+0.003
0.03%
jan 1, 2008
9.582
-0.148
-1.52%
jan 1, 2009
9.392
-0.189
-1.98%
jan 1, 2010
9.197
-0.195
-2.08%
jan 1, 2011
9.111
-0.086
-0.93%
jan 1, 2012
8.931
-0.18
-1.97%
jan 1, 2013
8.747
-0.184
-2.06%
jan 1, 2014
8.357
-0.39
-4.46%
jan 1, 2015
8.514
+0.157
1.88%
Ranking of countries by current statistics by years


Comments: