29
/
en
AIzaSyAYiBZKx7MnpbEhh9jyipgxe19OcubqV5w
April 1, 2024
72647
Australia
AUS
true
2
1
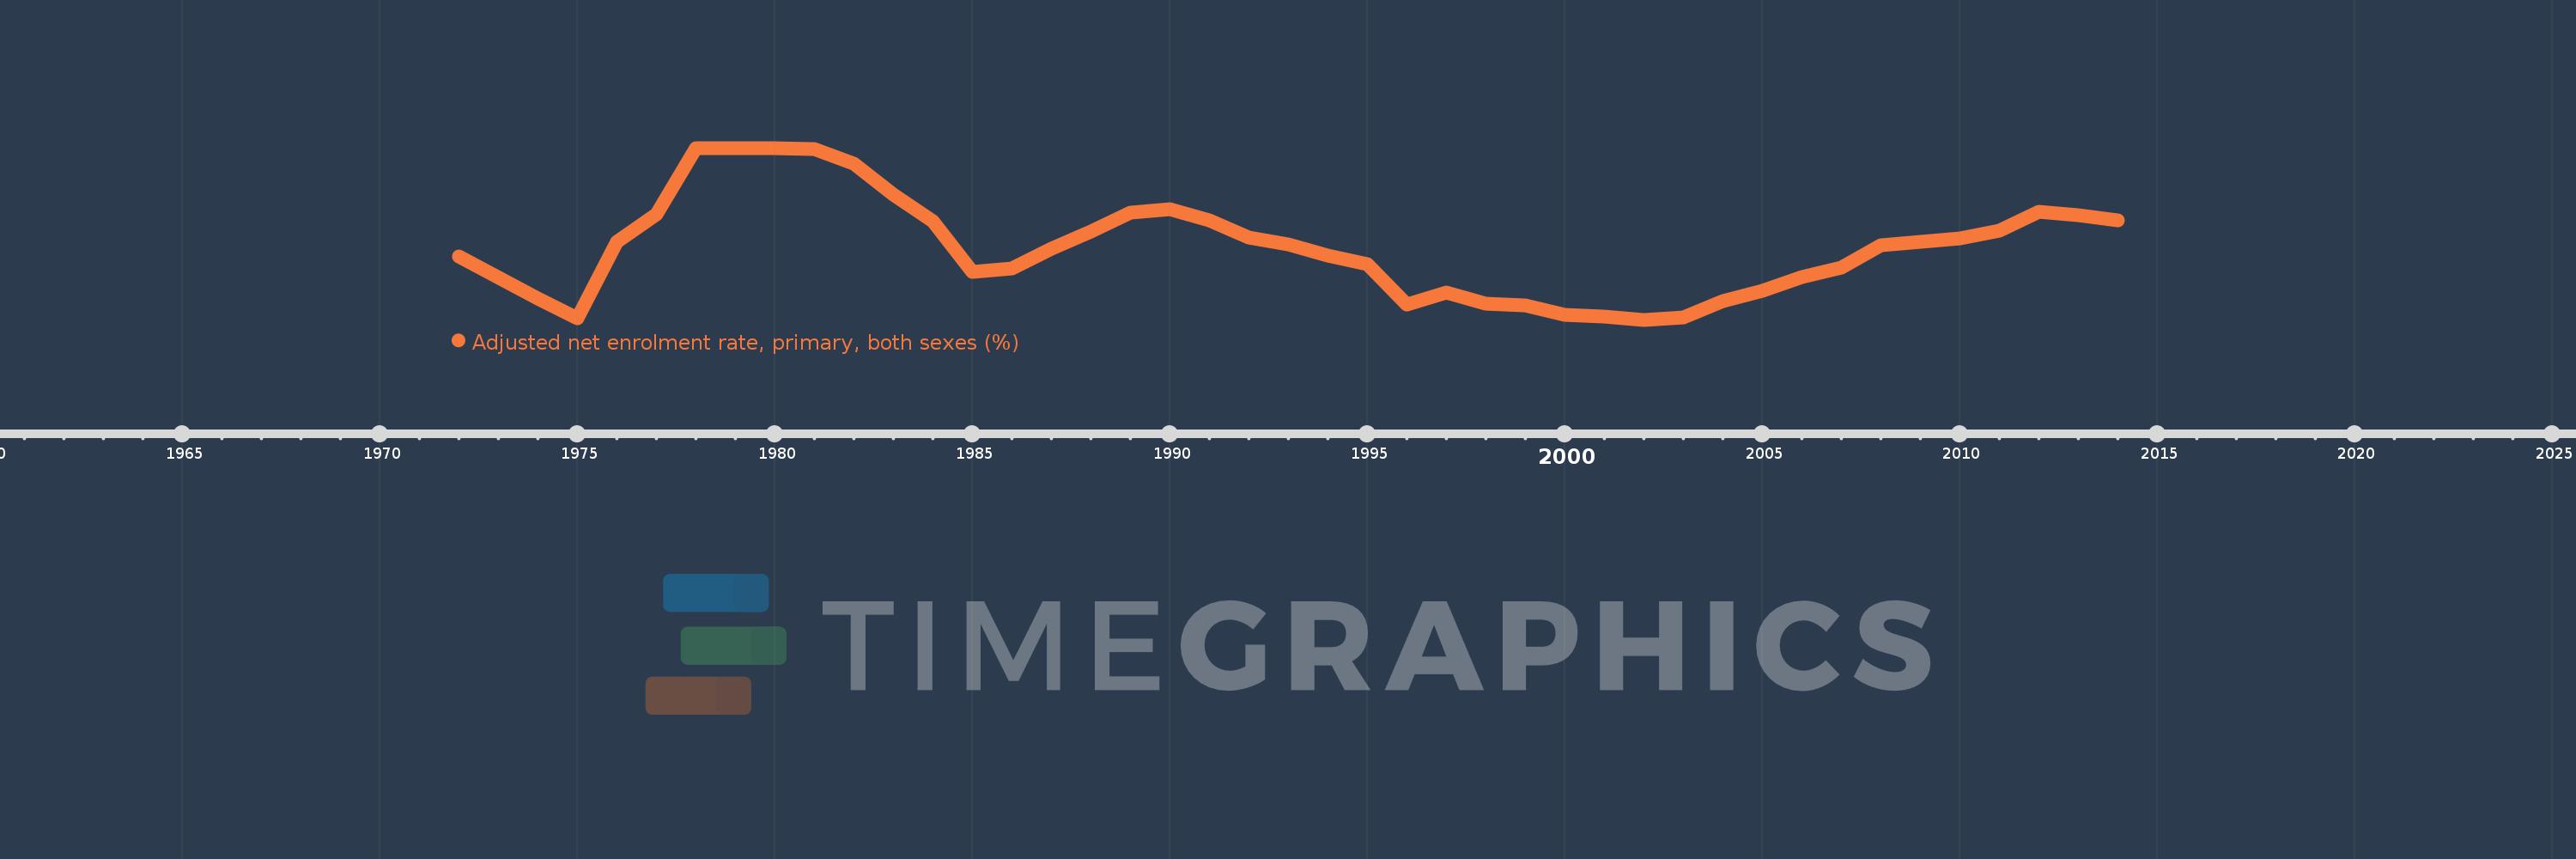
Adjusted net enrolment rate, primary, both sexes (%)
2014,2013,2012,2011,2010,2009,2008,2007,2006,2005,2004,2003,2002,2001,2000,1999,1998,1997,1996,1995,1994,1993,1992,1991,1990,1989,1988,1987,1986,1985,1984,1983,1982,1981,1980,1979,1978,1977,1976,1975,1974,1972
This statistics in other country:
AfghanistanAlbaniaAlgeriaAngolaAntigua and BarbudaArab WorldArgentinaArmeniaArubaAustraliaAustriaAzerbaijanBahamas, TheBahrainBangladeshBarbadosBelarusBelgiumBelizeBeninBermudaBhutanBoliviaBosnia and HerzegovinaBotswanaBrazilBrunei DarussalamBulgariaBurkina FasoBurundiCabo VerdeCambodiaCameroonCanadaCaribbean small statesCentral African RepublicCentral Europe and the BalticsChadChileChinaColombiaComorosCongo, Dem. Rep.Congo, Rep.Costa RicaCote d'IvoireCroatiaCubaCyprusDenmarkDjiboutiDominicaDominican RepublicEarly-demographic dividendEast Asia & PacificEast Asia & Pacific (excluding high income)East Asia & Pacific (IDA & IBRD countries)EcuadorEgypt, Arab Rep.El SalvadorEquatorial GuineaEritreaEstoniaEthiopiaEuro areaEurope & Central AsiaEurope & Central Asia (excluding high income)Europe & Central Asia (IDA & IBRD countries)European UnionFijiFinlandFragile and conflict affected situationsFranceGabonGambia, TheGeorgiaGermanyGhanaGreeceGrenadaGuatemalaGuineaGuinea-BissauGuyanaHaitiHeavily indebted poor countries (HIPC)High incomeHondurasHong Kong SAR, ChinaHungaryIBRD onlyIcelandIDA & IBRD totalIDA blendIDA onlyIDA totalIndiaIndonesiaIran, Islamic Rep.IraqIrelandIsraelItalyJamaicaJapanJordanKazakhstanKenyaKiribatiKorea, Dem. People’s Rep.Korea, Rep.KuwaitKyrgyz RepublicLao PDRLate-demographic dividendLatin America & Caribbean Latin America & Caribbean (excluding high income)Latin America & the Caribbean (IDA & IBRD countries)LatviaLeast developed countries: UN classificationLebanonLesothoLiberiaLibyaLiechtensteinLithuaniaLow & middle incomeLow incomeLower middle incomeLuxembourgMacao SAR, ChinaMacedonia, FYRMadagascarMalawiMalaysiaMaldivesMaliMaltaMarshall IslandsMauritaniaMauritiusMexicoMicronesia, Fed. Sts.Middle East & North AfricaMiddle East & North Africa (excluding high income)Middle East & North Africa (IDA & IBRD countries)Middle incomeMoldovaMongoliaMontenegroMoroccoMozambiqueMyanmarNamibiaNauruNepalNetherlandsNew ZealandNicaraguaNigerNigeriaNorth AmericaNorwayOECD membersOmanOther small statesPacific island small statesPakistanPalauPanamaPapua New GuineaParaguayPeruPhilippinesPolandPortugalPost-demographic dividendPre-demographic dividendPuerto RicoQatarRomaniaRussian FederationRwandaSamoaSan MarinoSao Tome and PrincipeSaudi ArabiaSenegalSerbiaSeychellesSierra LeoneSloveniaSmall statesSolomon IslandsSomaliaSouth AfricaSouth AsiaSouth Asia (IDA & IBRD)South SudanSpainSri LankaSt. Kitts and NevisSt. LuciaSt. Vincent and the GrenadinesSub-Saharan Africa Sub-Saharan Africa (excluding high income)Sub-Saharan Africa (IDA & IBRD countries)SudanSurinameSwazilandSwedenSwitzerlandSyrian Arab RepublicTajikistanTanzaniaThailandTimor-LesteTogoTongaTrinidad and TobagoTunisiaTurkeyTuvaluUgandaUkraineUnited Arab EmiratesUnited KingdomUnited StatesUpper middle incomeUruguayUzbekistanVanuatuVenezuela, RBVietnamWest Bank and GazaWorldYemen, Rep.ZambiaZimbabwe Timeline:
This timeline shows a graph from 1972 to 2014 of Australia. No data until 1971. Number of actual observations by date: 42.
Source name:
World Development Indicators
Source organization:
UNESCO Institute for Statistics
Categories, topics:
Education
Last updated:
apr 23, 2017
Indicators value changes by year
Minimum:
94.004
jan 1, 2002
Maximum:
99.984
jan 1, 1980
At the date of observation
Value
Absolute change
Change from previous value
jan 1, 1972
96.201
+96.201
0.0%
jan 1, 1974
94.744
-1.457
-1.51%
jan 1, 1975
94.054
-0.691
-0.73%
jan 1, 1976
96.716
+2.663
2.83%
jan 1, 1977
97.663
+0.947
0.98%
jan 1, 1978
99.963
+2.3
2.36%
jan 1, 1979
99.972
+0.009
0.01%
jan 1, 1980
99.984
+0.012
0.01%
jan 1, 1981
99.953
-0.031
-0.03%
jan 1, 1982
99.439
-0.514
-0.51%
jan 1, 1983
98.372
-1.067
-1.07%
jan 1, 1984
97.433
-0.939
-0.95%
jan 1, 1985
95.681
-1.752
-1.8%
jan 1, 1986
95.778
+0.098
0.1%
jan 1, 1987
96.486
+0.708
0.74%
jan 1, 1988
97.062
+0.576
0.6%
jan 1, 1989
97.747
+0.686
0.71%
jan 1, 1990
97.86
+0.113
0.12%
jan 1, 1991
97.458
-0.402
-0.41%
jan 1, 1992
96.87
-0.589
-0.6%
jan 1, 1993
96.641
-0.229
-0.24%
jan 1, 1994
96.234
-0.406
-0.42%
jan 1, 1995
95.944
-0.29
-0.3%
jan 1, 1996
94.528
-1.416
-1.48%
jan 1, 1997
94.949
+0.42
0.44%
jan 1, 1998
94.557
-0.392
-0.41%
jan 1, 1999
94.513
-0.044
-0.05%
jan 1, 2000
94.171
-0.342
-0.36%
jan 1, 2001
94.124
-0.047
-0.05%
jan 1, 2002
94.004
-0.12
-0.13%
jan 1, 2003
94.078
+0.074
0.08%
jan 1, 2004
94.644
+0.566
0.6%
jan 1, 2005
95.016
+0.372
0.39%
jan 1, 2006
95.49
+0.474
0.5%
jan 1, 2007
95.821
+0.331
0.35%
jan 1, 2008
96.598
+0.778
0.81%
jan 1, 2009
96.72
+0.121
0.13%
jan 1, 2010
96.84
+0.12
0.12%
jan 1, 2011
97.106
+0.266
0.27%
jan 1, 2012
97.766
+0.66
0.68%
jan 1, 2013
97.655
-0.111
-0.11%
jan 1, 2014
97.45
-0.205
-0.21%
Ranking of countries by current statistics by years


Comments: