29
/
en
AIzaSyAYiBZKx7MnpbEhh9jyipgxe19OcubqV5w
April 1, 2024
44777
Low & middle income
LMY
false
2
1
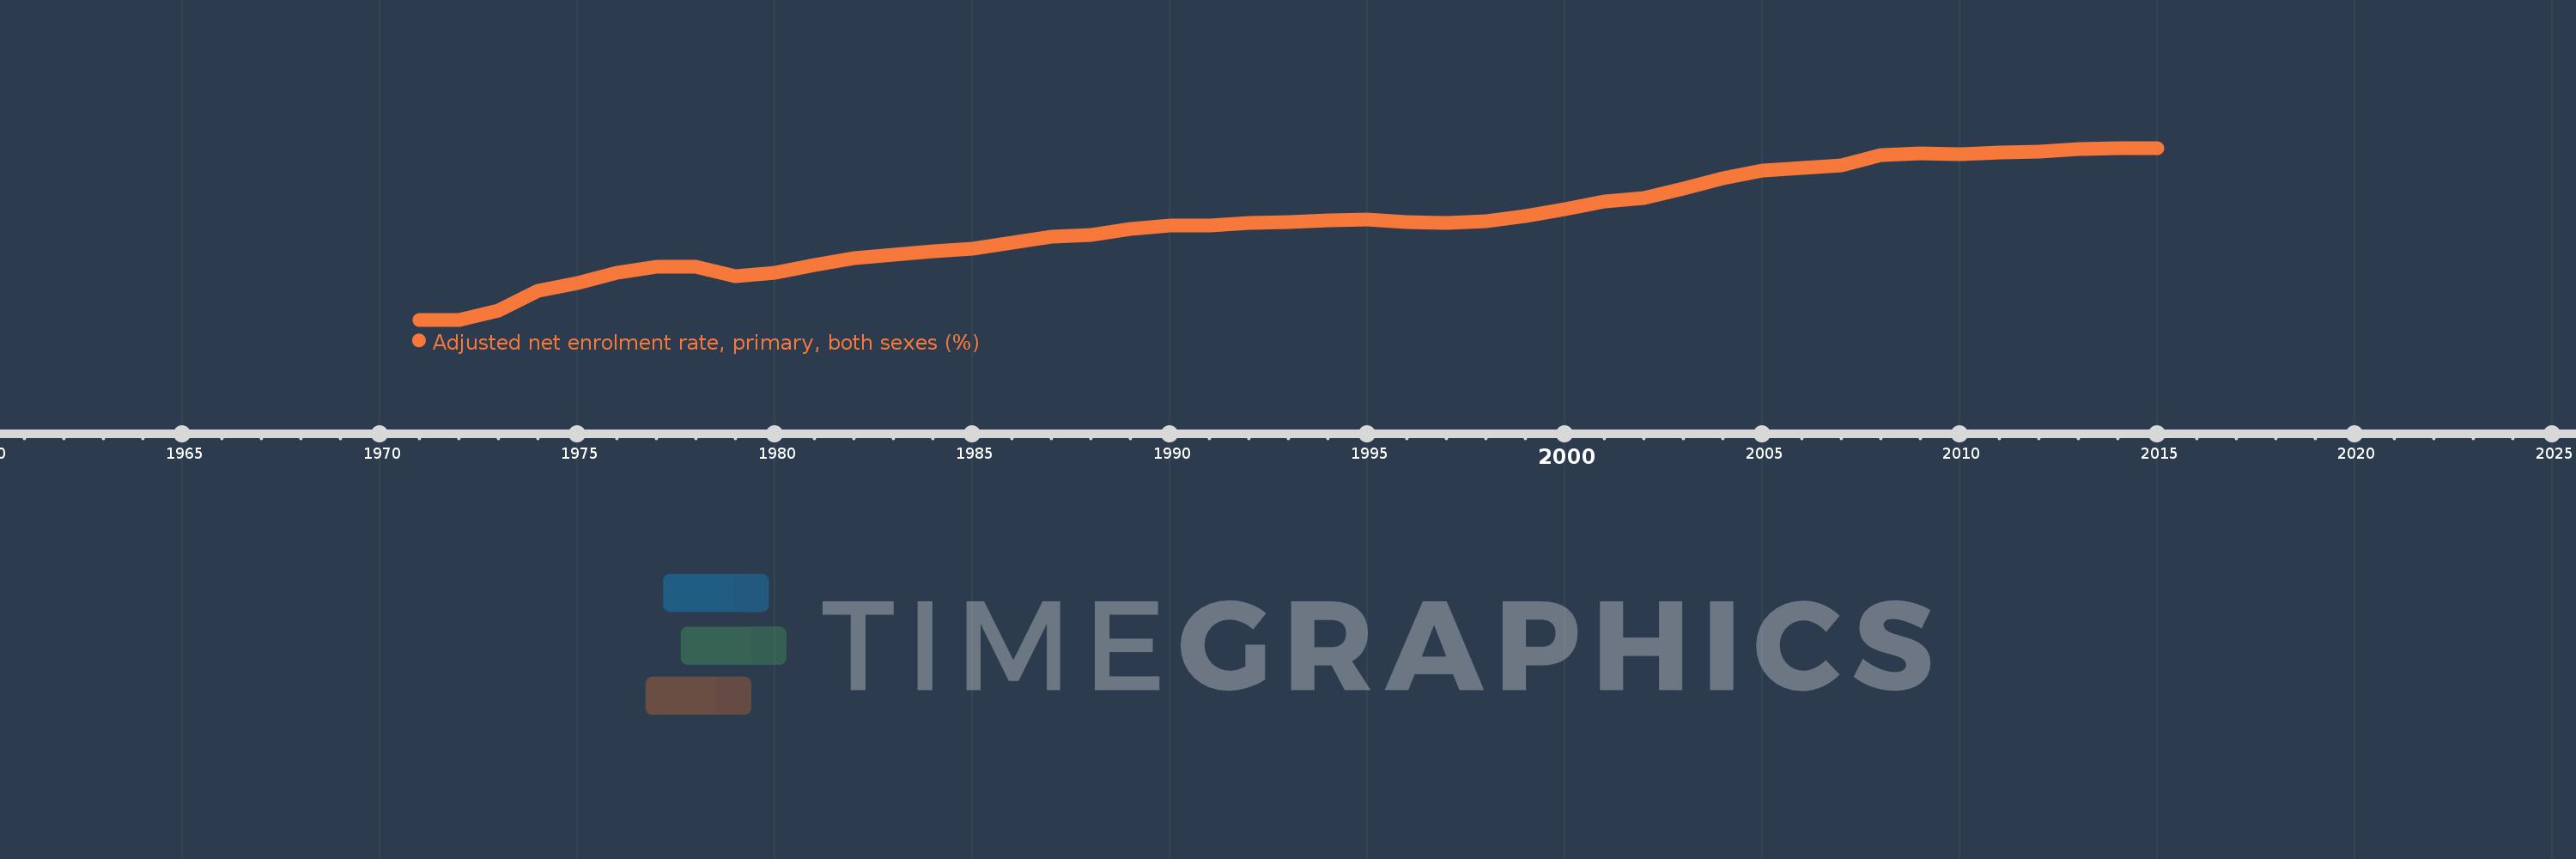
Adjusted net enrolment rate, primary, both sexes (%)
2015,2014,2013,2012,2011,2010,2009,2008,2007,2006,2005,2004,2003,2002,2001,2000,1999,1998,1997,1996,1995,1994,1993,1992,1991,1990,1989,1988,1987,1986,1985,1984,1983,1982,1981,1980,1979,1978,1977,1976,1975,1974,1973,1972,1971
This statistics in other country:
AfghanistanAlbaniaAlgeriaAngolaAntigua and BarbudaArab WorldArgentinaArmeniaArubaAustraliaAustriaAzerbaijanBahamas, TheBahrainBangladeshBarbadosBelarusBelgiumBelizeBeninBermudaBhutanBoliviaBosnia and HerzegovinaBotswanaBrazilBrunei DarussalamBulgariaBurkina FasoBurundiCabo VerdeCambodiaCameroonCanadaCaribbean small statesCentral African RepublicCentral Europe and the BalticsChadChileChinaColombiaComorosCongo, Dem. Rep.Congo, Rep.Costa RicaCote d'IvoireCroatiaCubaCyprusDenmarkDjiboutiDominicaDominican RepublicEarly-demographic dividendEast Asia & PacificEast Asia & Pacific (excluding high income)East Asia & Pacific (IDA & IBRD countries)EcuadorEgypt, Arab Rep.El SalvadorEquatorial GuineaEritreaEstoniaEthiopiaEuro areaEurope & Central AsiaEurope & Central Asia (excluding high income)Europe & Central Asia (IDA & IBRD countries)European UnionFijiFinlandFragile and conflict affected situationsFranceGabonGambia, TheGeorgiaGermanyGhanaGreeceGrenadaGuatemalaGuineaGuinea-BissauGuyanaHaitiHeavily indebted poor countries (HIPC)High incomeHondurasHong Kong SAR, ChinaHungaryIBRD onlyIcelandIDA & IBRD totalIDA blendIDA onlyIDA totalIndiaIndonesiaIran, Islamic Rep.IraqIrelandIsraelItalyJamaicaJapanJordanKazakhstanKenyaKiribatiKorea, Dem. People’s Rep.Korea, Rep.KuwaitKyrgyz RepublicLao PDRLate-demographic dividendLatin America & Caribbean Latin America & Caribbean (excluding high income)Latin America & the Caribbean (IDA & IBRD countries)LatviaLeast developed countries: UN classificationLebanonLesothoLiberiaLibyaLiechtensteinLithuaniaLow & middle incomeLow incomeLower middle incomeLuxembourgMacao SAR, ChinaMacedonia, FYRMadagascarMalawiMalaysiaMaldivesMaliMaltaMarshall IslandsMauritaniaMauritiusMexicoMicronesia, Fed. Sts.Middle East & North AfricaMiddle East & North Africa (excluding high income)Middle East & North Africa (IDA & IBRD countries)Middle incomeMoldovaMongoliaMontenegroMoroccoMozambiqueMyanmarNamibiaNauruNepalNetherlandsNew ZealandNicaraguaNigerNigeriaNorth AmericaNorwayOECD membersOmanOther small statesPacific island small statesPakistanPalauPanamaPapua New GuineaParaguayPeruPhilippinesPolandPortugalPost-demographic dividendPre-demographic dividendPuerto RicoQatarRomaniaRussian FederationRwandaSamoaSan MarinoSao Tome and PrincipeSaudi ArabiaSenegalSerbiaSeychellesSierra LeoneSloveniaSmall statesSolomon IslandsSomaliaSouth AfricaSouth AsiaSouth Asia (IDA & IBRD)South SudanSpainSri LankaSt. Kitts and NevisSt. LuciaSt. Vincent and the GrenadinesSub-Saharan Africa Sub-Saharan Africa (excluding high income)Sub-Saharan Africa (IDA & IBRD countries)SudanSurinameSwazilandSwedenSwitzerlandSyrian Arab RepublicTajikistanTanzaniaThailandTimor-LesteTogoTongaTrinidad and TobagoTunisiaTurkeyTuvaluUgandaUkraineUnited Arab EmiratesUnited KingdomUnited StatesUpper middle incomeUruguayUzbekistanVanuatuVenezuela, RBVietnamWest Bank and GazaWorldYemen, Rep.ZambiaZimbabwe Timeline:
This timeline shows a graph from 1971 to 2015 of Low & middle income. No data until 1970. Number of actual observations by date: 45.
Source name:
World Development Indicators
Source organization:
UNESCO Institute for Statistics
Categories, topics:
Education
Last updated:
apr 23, 2017
Indicators value changes by year
Minimum:
67.975
jan 1, 1972
Maximum:
90.441
jan 1, 2015
At the date of observation
Value
Absolute change
Change from previous value
jan 1, 1971
67.987
+67.987
0.0%
jan 1, 1972
67.975
-0.011
-0.02%
jan 1, 1973
69.159
+1.184
1.74%
jan 1, 1974
71.782
+2.622
3.79%
jan 1, 1975
72.771
+0.989
1.38%
jan 1, 1976
74.172
+1.401
1.93%
jan 1, 1977
74.891
+0.719
0.97%
jan 1, 1978
74.922
+0.031
0.04%
jan 1, 1979
73.674
-1.248
-1.67%
jan 1, 1980
74.096
+0.422
0.57%
jan 1, 1981
75.083
+0.987
1.33%
jan 1, 1982
75.994
+0.911
1.21%
jan 1, 1983
76.458
+0.463
0.61%
jan 1, 1984
76.883
+0.425
0.56%
jan 1, 1985
77.273
+0.39
0.51%
jan 1, 1986
78.002
+0.729
0.94%
jan 1, 1987
78.826
+0.825
1.06%
jan 1, 1988
79.118
+0.291
0.37%
jan 1, 1989
79.821
+0.703
0.89%
jan 1, 1990
80.318
+0.497
0.62%
jan 1, 1991
80.246
-0.071
-0.09%
jan 1, 1992
80.661
+0.415
0.52%
jan 1, 1993
80.714
+0.053
0.07%
jan 1, 1994
80.927
+0.213
0.26%
jan 1, 1995
81.103
+0.176
0.22%
jan 1, 1996
80.795
-0.308
-0.38%
jan 1, 1997
80.605
-0.19
-0.23%
jan 1, 1998
80.904
+0.299
0.37%
jan 1, 1999
81.538
+0.634
0.78%
jan 1, 2000
82.41
+0.872
1.07%
jan 1, 2001
83.393
+0.983
1.19%
jan 1, 2002
83.931
+0.537
0.64%
jan 1, 2003
85.132
+1.201
1.43%
jan 1, 2004
86.472
+1.34
1.57%
jan 1, 2005
87.537
+1.066
1.23%
jan 1, 2006
87.78
+0.243
0.28%
jan 1, 2007
88.207
+0.427
0.49%
jan 1, 2008
89.467
+1.259
1.43%
jan 1, 2009
89.68
+0.213
0.24%
jan 1, 2010
89.568
-0.112
-0.12%
jan 1, 2011
89.795
+0.227
0.25%
jan 1, 2012
89.955
+0.16
0.18%
jan 1, 2013
90.289
+0.334
0.37%
jan 1, 2014
90.36
+0.071
0.08%
jan 1, 2015
90.441
+0.081
0.09%
Ranking of countries by current statistics by years


Comments: