29
/
en
AIzaSyAYiBZKx7MnpbEhh9jyipgxe19OcubqV5w
April 1, 2024
267576
Tunisia
TUN
true
2
1
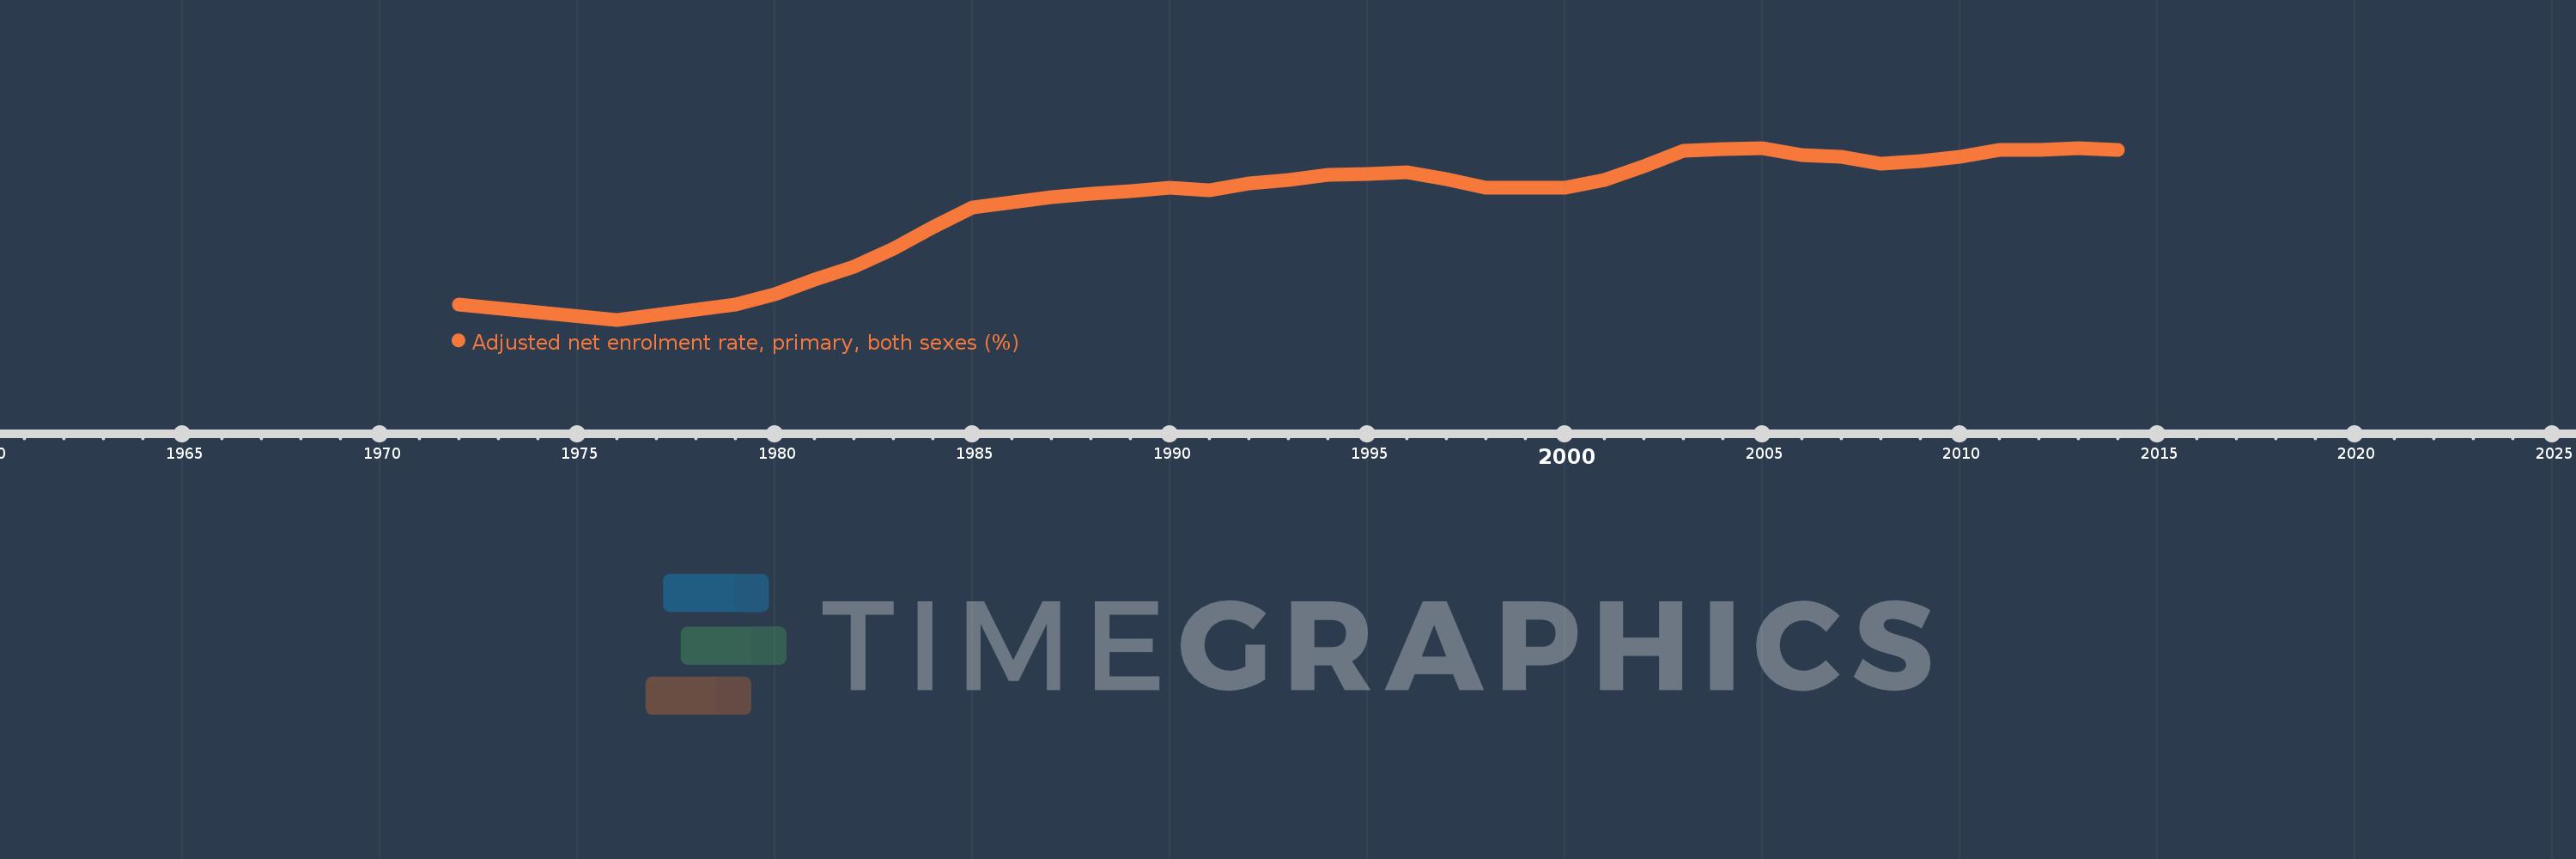
Adjusted net enrolment rate, primary, both sexes (%)
2014,2013,2012,2011,2010,2009,2008,2007,2006,2005,2004,2003,2002,2001,2000,1998,1997,1996,1995,1994,1993,1992,1991,1990,1989,1988,1987,1986,1985,1984,1983,1982,1981,1980,1979,1976,1972
This statistics in other country:
AfghanistanAlbaniaAlgeriaAngolaAntigua and BarbudaArab WorldArgentinaArmeniaArubaAustraliaAustriaAzerbaijanBahamas, TheBahrainBangladeshBarbadosBelarusBelgiumBelizeBeninBermudaBhutanBoliviaBosnia and HerzegovinaBotswanaBrazilBrunei DarussalamBulgariaBurkina FasoBurundiCabo VerdeCambodiaCameroonCanadaCaribbean small statesCentral African RepublicCentral Europe and the BalticsChadChileChinaColombiaComorosCongo, Dem. Rep.Congo, Rep.Costa RicaCote d'IvoireCroatiaCubaCyprusDenmarkDjiboutiDominicaDominican RepublicEarly-demographic dividendEast Asia & PacificEast Asia & Pacific (excluding high income)East Asia & Pacific (IDA & IBRD countries)EcuadorEgypt, Arab Rep.El SalvadorEquatorial GuineaEritreaEstoniaEthiopiaEuro areaEurope & Central AsiaEurope & Central Asia (excluding high income)Europe & Central Asia (IDA & IBRD countries)European UnionFijiFinlandFragile and conflict affected situationsFranceGabonGambia, TheGeorgiaGermanyGhanaGreeceGrenadaGuatemalaGuineaGuinea-BissauGuyanaHaitiHeavily indebted poor countries (HIPC)High incomeHondurasHong Kong SAR, ChinaHungaryIBRD onlyIcelandIDA & IBRD totalIDA blendIDA onlyIDA totalIndiaIndonesiaIran, Islamic Rep.IraqIrelandIsraelItalyJamaicaJapanJordanKazakhstanKenyaKiribatiKorea, Dem. People’s Rep.Korea, Rep.KuwaitKyrgyz RepublicLao PDRLate-demographic dividendLatin America & Caribbean Latin America & Caribbean (excluding high income)Latin America & the Caribbean (IDA & IBRD countries)LatviaLeast developed countries: UN classificationLebanonLesothoLiberiaLibyaLiechtensteinLithuaniaLow & middle incomeLow incomeLower middle incomeLuxembourgMacao SAR, ChinaMacedonia, FYRMadagascarMalawiMalaysiaMaldivesMaliMaltaMarshall IslandsMauritaniaMauritiusMexicoMicronesia, Fed. Sts.Middle East & North AfricaMiddle East & North Africa (excluding high income)Middle East & North Africa (IDA & IBRD countries)Middle incomeMoldovaMongoliaMontenegroMoroccoMozambiqueMyanmarNamibiaNauruNepalNetherlandsNew ZealandNicaraguaNigerNigeriaNorth AmericaNorwayOECD membersOmanOther small statesPacific island small statesPakistanPalauPanamaPapua New GuineaParaguayPeruPhilippinesPolandPortugalPost-demographic dividendPre-demographic dividendPuerto RicoQatarRomaniaRussian FederationRwandaSamoaSan MarinoSao Tome and PrincipeSaudi ArabiaSenegalSerbiaSeychellesSierra LeoneSloveniaSmall statesSolomon IslandsSomaliaSouth AfricaSouth AsiaSouth Asia (IDA & IBRD)South SudanSpainSri LankaSt. Kitts and NevisSt. LuciaSt. Vincent and the GrenadinesSub-Saharan Africa Sub-Saharan Africa (excluding high income)Sub-Saharan Africa (IDA & IBRD countries)SudanSurinameSwazilandSwedenSwitzerlandSyrian Arab RepublicTajikistanTanzaniaThailandTimor-LesteTogoTongaTrinidad and TobagoTunisiaTurkeyTuvaluUgandaUkraineUnited Arab EmiratesUnited KingdomUnited StatesUpper middle incomeUruguayUzbekistanVanuatuVenezuela, RBVietnamWest Bank and GazaWorldYemen, Rep.ZambiaZimbabwe Timeline:
This timeline shows a graph from 1972 to 2014 of Tunisia. No data until 1971. Number of actual observations by date: 37.
Source name:
World Development Indicators
Source organization:
UNESCO Institute for Statistics
Categories, topics:
Education
Last updated:
apr 23, 2017
Indicators value changes by year
Minimum:
75.798
jan 1, 1976
Maximum:
99.889
jan 1, 2013
At the date of observation
Value
Absolute change
Change from previous value
jan 1, 1972
77.875
+77.875
0.0%
jan 1, 1976
75.798
-2.077
-2.67%
jan 1, 1979
77.927
+2.129
2.81%
jan 1, 1980
79.371
+1.444
1.85%
jan 1, 1981
81.441
+2.07
2.61%
jan 1, 1982
83.174
+1.733
2.13%
jan 1, 1983
85.768
+2.594
3.12%
jan 1, 1984
88.827
+3.06
3.57%
jan 1, 1985
91.573
+2.746
3.09%
jan 1, 1986
92.32
+0.747
0.82%
jan 1, 1987
92.997
+0.677
0.73%
jan 1, 1988
93.517
+0.519
0.56%
jan 1, 1989
93.836
+0.319
0.34%
jan 1, 1990
94.297
+0.462
0.49%
jan 1, 1991
93.946
-0.352
-0.37%
jan 1, 1992
94.95
+1.004
1.07%
jan 1, 1993
95.336
+0.387
0.41%
jan 1, 1994
96.174
+0.838
0.88%
jan 1, 1995
96.189
+0.014
0.01%
jan 1, 1996
96.424
+0.236
0.25%
jan 1, 1997
95.461
-0.964
-1.0%
jan 1, 1998
94.338
-1.123
-1.18%
jan 1, 2000
94.345
+0.007
0.01%
jan 1, 2001
95.438
+1.093
1.16%
jan 1, 2002
97.286
+1.848
1.94%
jan 1, 2003
99.477
+2.191
2.25%
jan 1, 2004
99.698
+0.22
0.22%
jan 1, 2005
99.841
+0.143
0.14%
jan 1, 2006
98.87
-0.971
-0.97%
jan 1, 2007
98.63
-0.24
-0.24%
jan 1, 2008
97.653
-0.977
-0.99%
jan 1, 2009
98.008
+0.355
0.36%
jan 1, 2010
98.621
+0.613
0.63%
jan 1, 2011
99.632
+1.01
1.02%
jan 1, 2012
99.634
+0.002
0.0%
jan 1, 2013
99.889
+0.255
0.26%
jan 1, 2014
99.613
-0.276
-0.28%
Ranking of countries by current statistics by years


Comments: