29
/
en
AIzaSyAYiBZKx7MnpbEhh9jyipgxe19OcubqV5w
April 1, 2024
34715
Heavily indebted poor countries (HIPC)
HPC
false
2
1
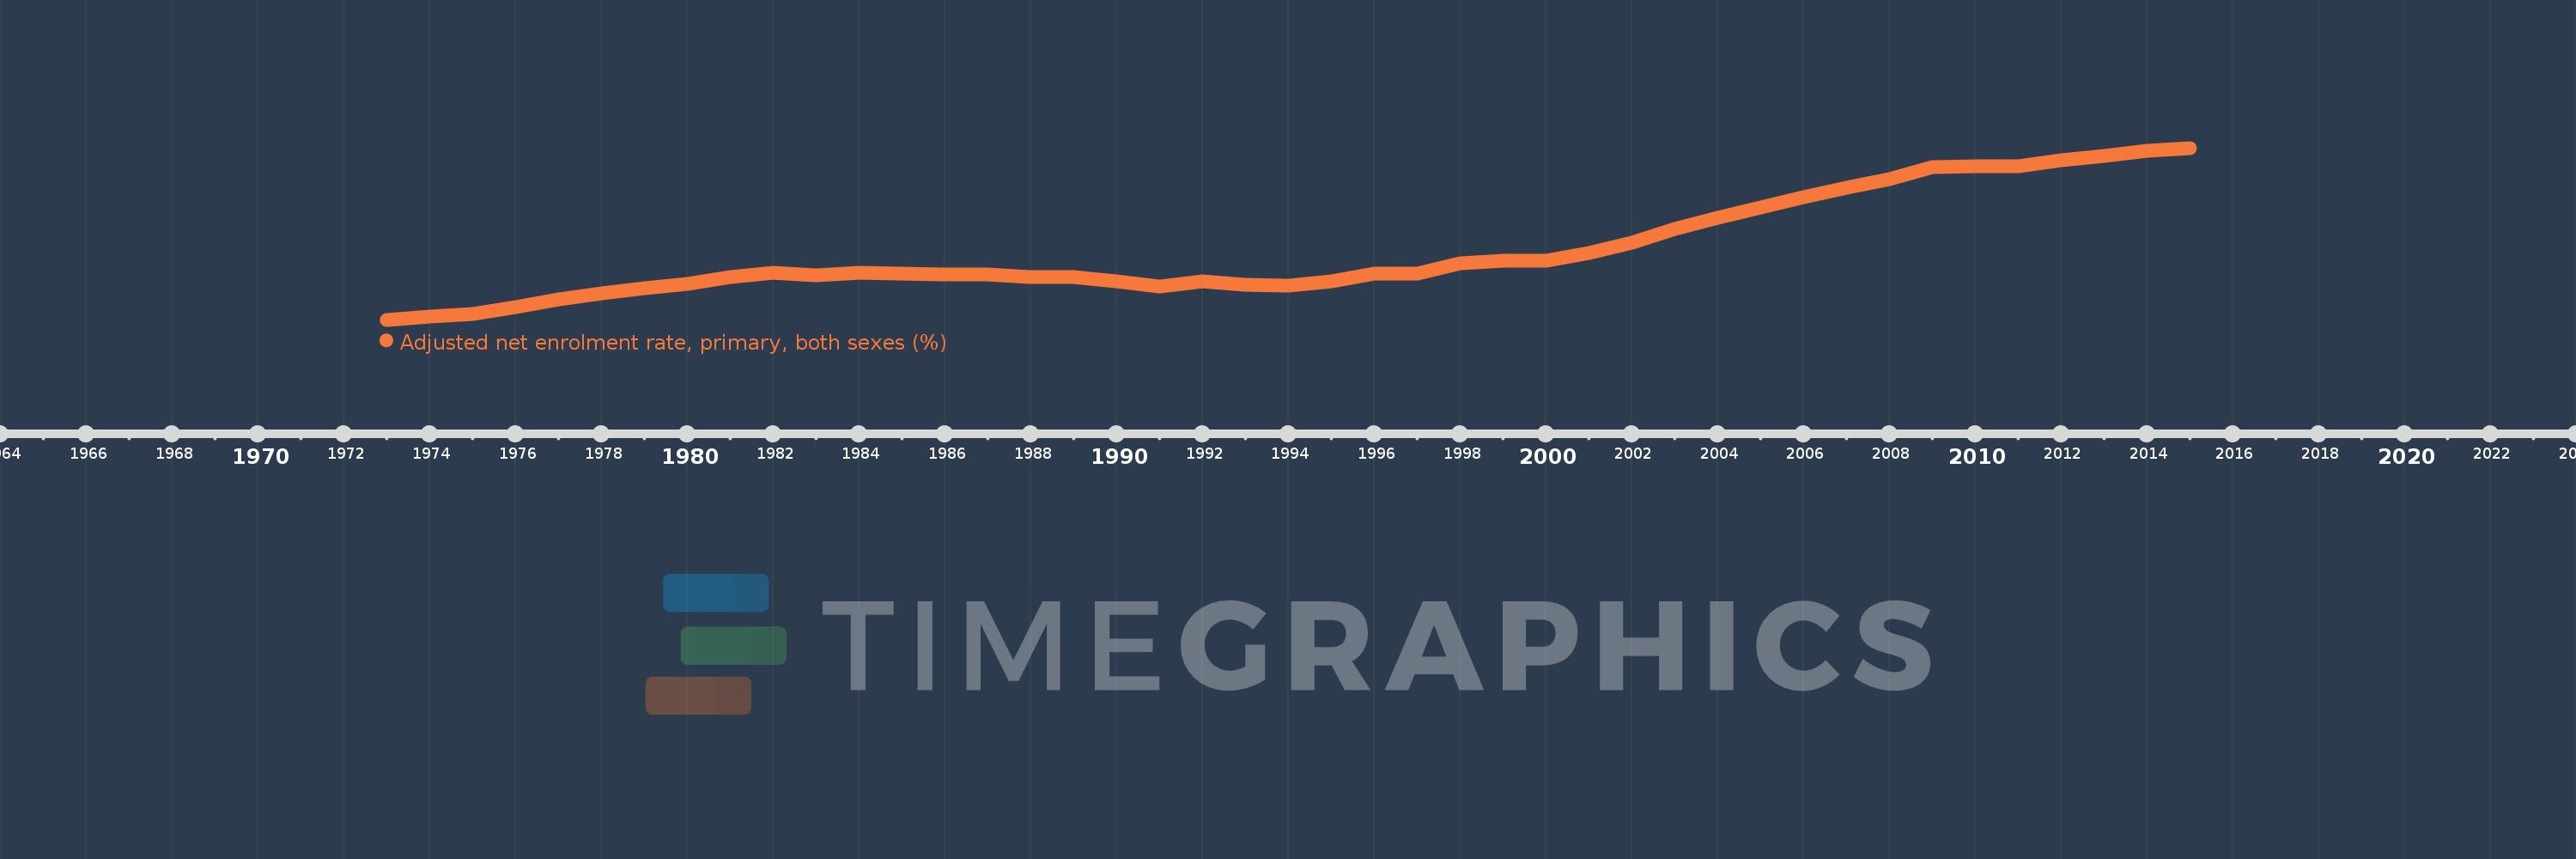
Adjusted net enrolment rate, primary, both sexes (%)
2015,2014,2013,2012,2011,2010,2009,2008,2007,2006,2005,2004,2003,2002,2001,2000,1999,1998,1997,1996,1995,1994,1993,1992,1991,1990,1989,1988,1987,1986,1985,1984,1983,1982,1981,1980,1979,1978,1977,1976,1975,1974,1973
This statistics in other country:
AfghanistanAlbaniaAlgeriaAngolaAntigua and BarbudaArab WorldArgentinaArmeniaArubaAustraliaAustriaAzerbaijanBahamas, TheBahrainBangladeshBarbadosBelarusBelgiumBelizeBeninBermudaBhutanBoliviaBosnia and HerzegovinaBotswanaBrazilBrunei DarussalamBulgariaBurkina FasoBurundiCabo VerdeCambodiaCameroonCanadaCaribbean small statesCentral African RepublicCentral Europe and the BalticsChadChileChinaColombiaComorosCongo, Dem. Rep.Congo, Rep.Costa RicaCote d'IvoireCroatiaCubaCyprusDenmarkDjiboutiDominicaDominican RepublicEarly-demographic dividendEast Asia & PacificEast Asia & Pacific (excluding high income)East Asia & Pacific (IDA & IBRD countries)EcuadorEgypt, Arab Rep.El SalvadorEquatorial GuineaEritreaEstoniaEthiopiaEuro areaEurope & Central AsiaEurope & Central Asia (excluding high income)Europe & Central Asia (IDA & IBRD countries)European UnionFijiFinlandFragile and conflict affected situationsFranceGabonGambia, TheGeorgiaGermanyGhanaGreeceGrenadaGuatemalaGuineaGuinea-BissauGuyanaHaitiHeavily indebted poor countries (HIPC)High incomeHondurasHong Kong SAR, ChinaHungaryIBRD onlyIcelandIDA & IBRD totalIDA blendIDA onlyIDA totalIndiaIndonesiaIran, Islamic Rep.IraqIrelandIsraelItalyJamaicaJapanJordanKazakhstanKenyaKiribatiKorea, Dem. People’s Rep.Korea, Rep.KuwaitKyrgyz RepublicLao PDRLate-demographic dividendLatin America & Caribbean Latin America & Caribbean (excluding high income)Latin America & the Caribbean (IDA & IBRD countries)LatviaLeast developed countries: UN classificationLebanonLesothoLiberiaLibyaLiechtensteinLithuaniaLow & middle incomeLow incomeLower middle incomeLuxembourgMacao SAR, ChinaMacedonia, FYRMadagascarMalawiMalaysiaMaldivesMaliMaltaMarshall IslandsMauritaniaMauritiusMexicoMicronesia, Fed. Sts.Middle East & North AfricaMiddle East & North Africa (excluding high income)Middle East & North Africa (IDA & IBRD countries)Middle incomeMoldovaMongoliaMontenegroMoroccoMozambiqueMyanmarNamibiaNauruNepalNetherlandsNew ZealandNicaraguaNigerNigeriaNorth AmericaNorwayOECD membersOmanOther small statesPacific island small statesPakistanPalauPanamaPapua New GuineaParaguayPeruPhilippinesPolandPortugalPost-demographic dividendPre-demographic dividendPuerto RicoQatarRomaniaRussian FederationRwandaSamoaSan MarinoSao Tome and PrincipeSaudi ArabiaSenegalSerbiaSeychellesSierra LeoneSloveniaSmall statesSolomon IslandsSomaliaSouth AfricaSouth AsiaSouth Asia (IDA & IBRD)South SudanSpainSri LankaSt. Kitts and NevisSt. LuciaSt. Vincent and the GrenadinesSub-Saharan Africa Sub-Saharan Africa (excluding high income)Sub-Saharan Africa (IDA & IBRD countries)SudanSurinameSwazilandSwedenSwitzerlandSyrian Arab RepublicTajikistanTanzaniaThailandTimor-LesteTogoTongaTrinidad and TobagoTunisiaTurkeyTuvaluUgandaUkraineUnited Arab EmiratesUnited KingdomUnited StatesUpper middle incomeUruguayUzbekistanVanuatuVenezuela, RBVietnamWest Bank and GazaWorldYemen, Rep.ZambiaZimbabwe Timeline:
This timeline shows a graph from 1973 to 2015 of Heavily indebted poor countries (HIPC). No data until 1972. Number of actual observations by date: 43.
Source name:
World Development Indicators
Source organization:
UNESCO Institute for Statistics
Categories, topics:
Education
Last updated:
apr 23, 2017
Indicators value changes by year
Minimum:
37.317
jan 1, 1973
At the date of observation
Value
Absolute change
Change from previous value
jan 1, 1973
37.317
+37.317
0.0%
jan 1, 1974
38.169
+0.853
2.28%
jan 1, 1975
38.849
+0.68
1.78%
jan 1, 1976
40.492
+1.643
4.23%
jan 1, 1977
42.358
+1.866
4.61%
jan 1, 1978
43.896
+1.538
3.63%
jan 1, 1979
45.258
+1.362
3.1%
jan 1, 1980
46.411
+1.153
2.55%
jan 1, 1981
48.07
+1.659
3.58%
jan 1, 1982
49.225
+1.155
2.4%
jan 1, 1983
48.553
-0.672
-1.36%
jan 1, 1984
49.282
+0.729
1.5%
jan 1, 1985
49.051
-0.231
-0.47%
jan 1, 1986
48.854
-0.197
-0.4%
jan 1, 1987
48.829
-0.025
-0.05%
jan 1, 1988
48.14
-0.689
-1.41%
jan 1, 1989
48.04
-0.1
-0.21%
jan 1, 1990
46.918
-1.122
-2.33%
jan 1, 1991
45.772
-1.147
-2.44%
jan 1, 1992
47.016
+1.244
2.72%
jan 1, 1993
46.096
-0.919
-1.96%
jan 1, 1994
45.921
-0.176
-0.38%
jan 1, 1995
46.92
+0.999
2.18%
jan 1, 1996
48.913
+1.994
4.25%
jan 1, 1997
48.917
+0.004
0.01%
jan 1, 1998
51.58
+2.663
5.44%
jan 1, 1999
52.246
+0.667
1.29%
jan 1, 2000
52.179
-0.067
-0.13%
jan 1, 2001
54.088
+1.909
3.66%
jan 1, 2002
56.702
+2.614
4.83%
jan 1, 2003
60.195
+3.493
6.16%
jan 1, 2004
63.091
+2.896
4.81%
jan 1, 2005
65.647
+2.557
4.05%
jan 1, 2006
68.347
+2.699
4.11%
jan 1, 2007
70.744
+2.397
3.51%
jan 1, 2008
72.719
+1.976
2.79%
jan 1, 2009
75.937
+3.218
4.42%
jan 1, 2010
76.089
+0.152
0.2%
jan 1, 2011
76.066
-0.023
-0.03%
jan 1, 2012
77.511
+1.446
1.9%
jan 1, 2013
78.707
+1.196
1.54%
jan 1, 2014
79.9
+1.193
1.52%
jan 1, 2015
80.69
+0.79
0.99%
Ranking of countries by current statistics by years


Comments: