29
/
en
AIzaSyAYiBZKx7MnpbEhh9jyipgxe19OcubqV5w
April 1, 2024
116573
Cyprus
CYP
true
2
1
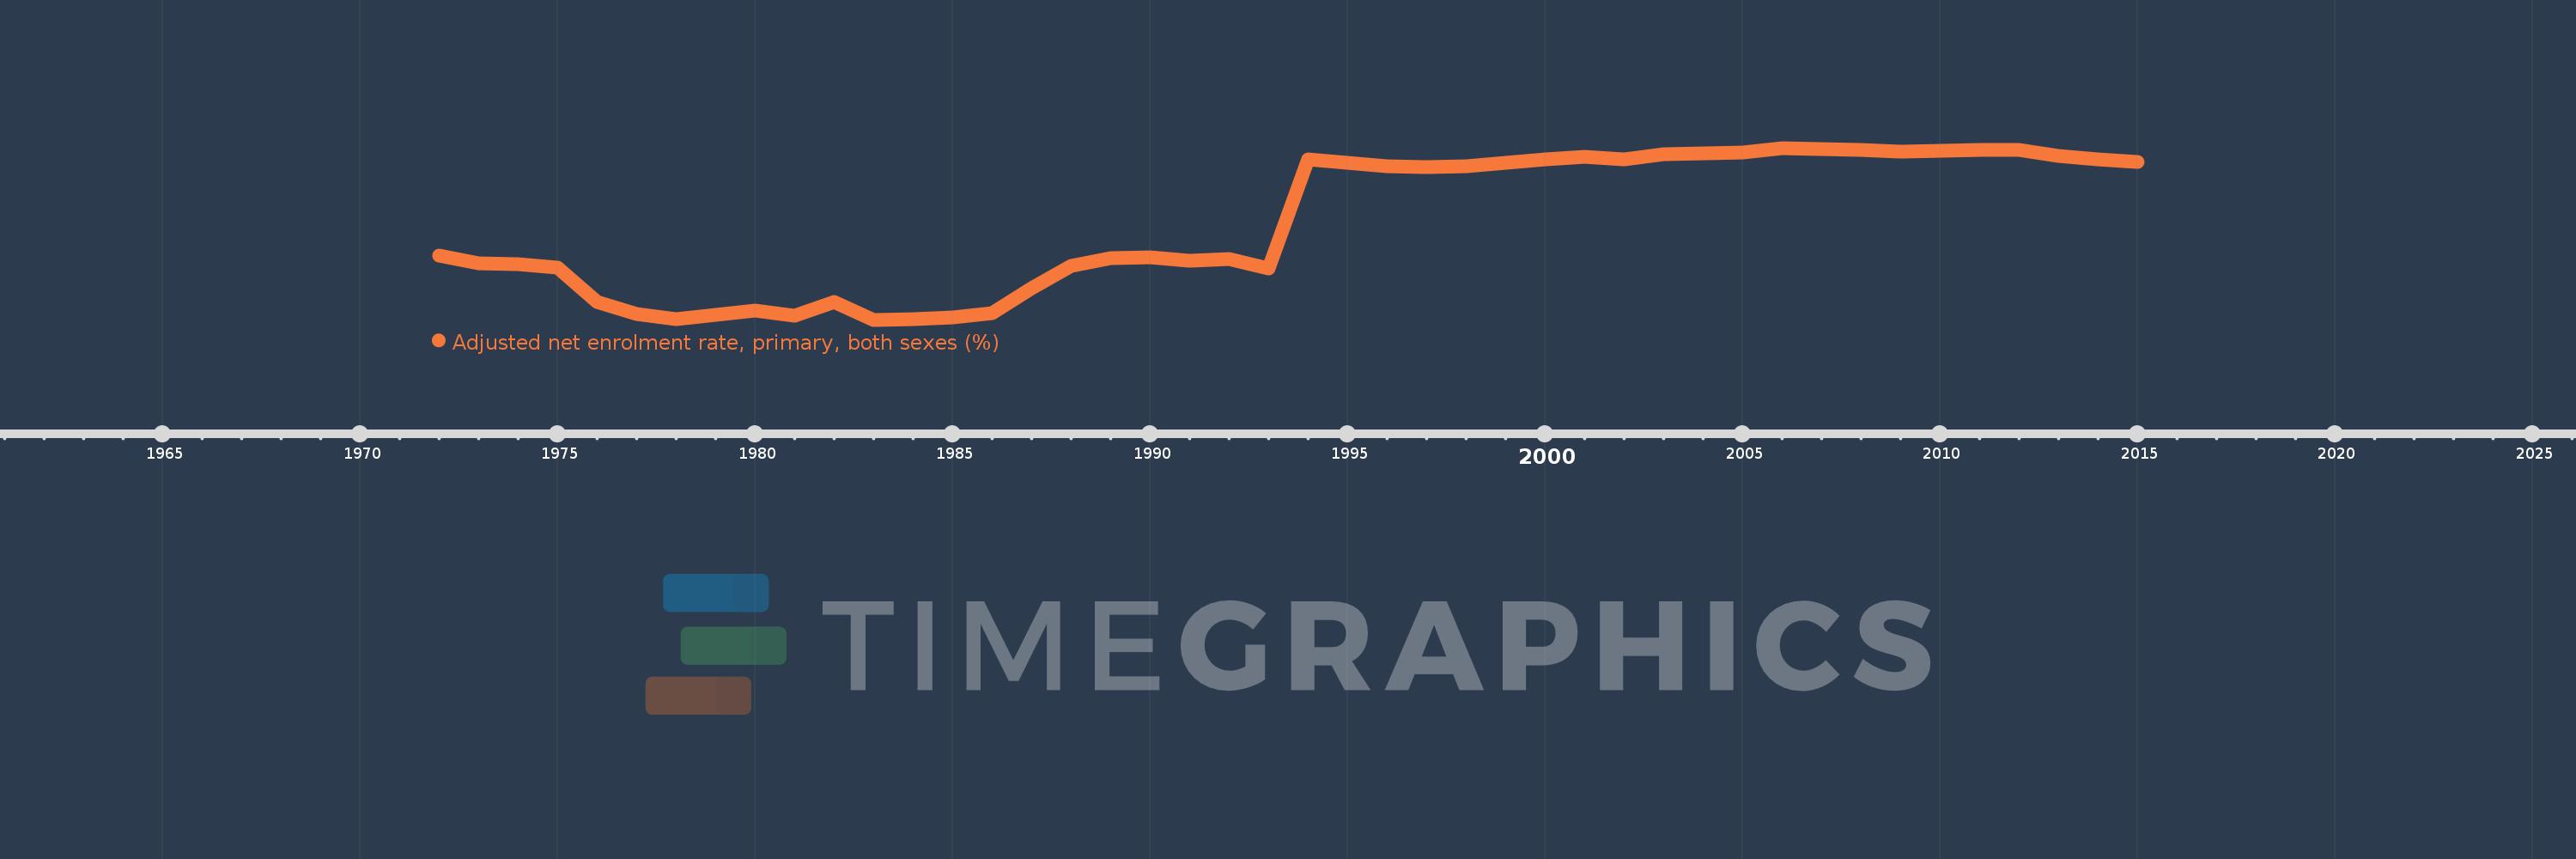
Adjusted net enrolment rate, primary, both sexes (%)
2015,2014,2013,2012,2011,2010,2009,2008,2007,2006,2005,2004,2003,2002,2001,2000,1998,1997,1996,1995,1994,1993,1992,1991,1990,1989,1988,1987,1986,1985,1984,1983,1982,1981,1980,1979,1978,1977,1976,1975,1974,1973,1972
This statistics in other country:
AfghanistanAlbaniaAlgeriaAngolaAntigua and BarbudaArab WorldArgentinaArmeniaArubaAustraliaAustriaAzerbaijanBahamas, TheBahrainBangladeshBarbadosBelarusBelgiumBelizeBeninBermudaBhutanBoliviaBosnia and HerzegovinaBotswanaBrazilBrunei DarussalamBulgariaBurkina FasoBurundiCabo VerdeCambodiaCameroonCanadaCaribbean small statesCentral African RepublicCentral Europe and the BalticsChadChileChinaColombiaComorosCongo, Dem. Rep.Congo, Rep.Costa RicaCote d'IvoireCroatiaCubaCyprusDenmarkDjiboutiDominicaDominican RepublicEarly-demographic dividendEast Asia & PacificEast Asia & Pacific (excluding high income)East Asia & Pacific (IDA & IBRD countries)EcuadorEgypt, Arab Rep.El SalvadorEquatorial GuineaEritreaEstoniaEthiopiaEuro areaEurope & Central AsiaEurope & Central Asia (excluding high income)Europe & Central Asia (IDA & IBRD countries)European UnionFijiFinlandFragile and conflict affected situationsFranceGabonGambia, TheGeorgiaGermanyGhanaGreeceGrenadaGuatemalaGuineaGuinea-BissauGuyanaHaitiHeavily indebted poor countries (HIPC)High incomeHondurasHong Kong SAR, ChinaHungaryIBRD onlyIcelandIDA & IBRD totalIDA blendIDA onlyIDA totalIndiaIndonesiaIran, Islamic Rep.IraqIrelandIsraelItalyJamaicaJapanJordanKazakhstanKenyaKiribatiKorea, Dem. People’s Rep.Korea, Rep.KuwaitKyrgyz RepublicLao PDRLate-demographic dividendLatin America & Caribbean Latin America & Caribbean (excluding high income)Latin America & the Caribbean (IDA & IBRD countries)LatviaLeast developed countries: UN classificationLebanonLesothoLiberiaLibyaLiechtensteinLithuaniaLow & middle incomeLow incomeLower middle incomeLuxembourgMacao SAR, ChinaMacedonia, FYRMadagascarMalawiMalaysiaMaldivesMaliMaltaMarshall IslandsMauritaniaMauritiusMexicoMicronesia, Fed. Sts.Middle East & North AfricaMiddle East & North Africa (excluding high income)Middle East & North Africa (IDA & IBRD countries)Middle incomeMoldovaMongoliaMontenegroMoroccoMozambiqueMyanmarNamibiaNauruNepalNetherlandsNew ZealandNicaraguaNigerNigeriaNorth AmericaNorwayOECD membersOmanOther small statesPacific island small statesPakistanPalauPanamaPapua New GuineaParaguayPeruPhilippinesPolandPortugalPost-demographic dividendPre-demographic dividendPuerto RicoQatarRomaniaRussian FederationRwandaSamoaSan MarinoSao Tome and PrincipeSaudi ArabiaSenegalSerbiaSeychellesSierra LeoneSloveniaSmall statesSolomon IslandsSomaliaSouth AfricaSouth AsiaSouth Asia (IDA & IBRD)South SudanSpainSri LankaSt. Kitts and NevisSt. LuciaSt. Vincent and the GrenadinesSub-Saharan Africa Sub-Saharan Africa (excluding high income)Sub-Saharan Africa (IDA & IBRD countries)SudanSurinameSwazilandSwedenSwitzerlandSyrian Arab RepublicTajikistanTanzaniaThailandTimor-LesteTogoTongaTrinidad and TobagoTunisiaTurkeyTuvaluUgandaUkraineUnited Arab EmiratesUnited KingdomUnited StatesUpper middle incomeUruguayUzbekistanVanuatuVenezuela, RBVietnamWest Bank and GazaWorldYemen, Rep.ZambiaZimbabwe Timeline:
This timeline shows a graph from 1972 to 2015 of Cyprus. No data until 1971. Number of actual observations by date: 43.
Source name:
World Development Indicators
Source organization:
UNESCO Institute for Statistics
Categories, topics:
Education
Last updated:
apr 23, 2017
Indicators value changes by year
Minimum:
67.938
jan 1, 1983
Maximum:
99.662
jan 1, 2006
At the date of observation
Value
Absolute change
Change from previous value
jan 1, 1972
79.731
+79.731
0.0%
jan 1, 1973
78.38
-1.351
-1.69%
jan 1, 1974
78.275
-0.105
-0.13%
jan 1, 1975
77.645
-0.63
-0.8%
jan 1, 1976
71.22
-6.425
-8.28%
jan 1, 1977
68.998
-2.222
-3.12%
jan 1, 1978
68.078
-0.919
-1.33%
jan 1, 1979
68.853
+0.775
1.14%
jan 1, 1980
69.574
+0.721
1.05%
jan 1, 1981
68.734
-0.84
-1.21%
jan 1, 1982
71.214
+2.479
3.61%
jan 1, 1983
67.938
-3.275
-4.6%
jan 1, 1984
68.098
+0.16
0.23%
jan 1, 1985
68.372
+0.274
0.4%
jan 1, 1986
69.166
+0.795
1.16%
jan 1, 1987
73.803
+4.637
6.7%
jan 1, 1988
77.857
+4.054
5.49%
jan 1, 1989
79.335
+1.478
1.9%
jan 1, 1990
79.46
+0.125
0.16%
jan 1, 1991
78.822
-0.638
-0.8%
jan 1, 1992
79.153
+0.331
0.42%
jan 1, 1993
77.359
-1.794
-2.27%
jan 1, 1994
97.629
+20.27
26.2%
jan 1, 1995
96.917
-0.713
-0.73%
jan 1, 1996
96.213
-0.704
-0.73%
jan 1, 1997
96.117
-0.096
-0.1%
jan 1, 1998
96.285
+0.167
0.17%
jan 1, 2000
97.624
+1.339
1.39%
jan 1, 2001
98.07
+0.446
0.46%
jan 1, 2002
97.54
-0.53
-0.54%
jan 1, 2003
98.507
+0.967
0.99%
jan 1, 2004
98.635
+0.128
0.13%
jan 1, 2005
98.76
+0.125
0.13%
jan 1, 2006
99.662
+0.902
0.91%
jan 1, 2007
99.52
-0.142
-0.14%
jan 1, 2008
99.342
-0.178
-0.18%
jan 1, 2009
98.961
-0.381
-0.38%
jan 1, 2010
99.145
+0.183
0.19%
jan 1, 2011
99.285
+0.14
0.14%
jan 1, 2012
99.28
-0.005
-0.01%
jan 1, 2013
98.176
-1.104
-1.11%
jan 1, 2014
97.494
-0.682
-0.69%
jan 1, 2015
97.135
-0.359
-0.37%
Ranking of countries by current statistics by years


Comments: