29
/
en
AIzaSyAYiBZKx7MnpbEhh9jyipgxe19OcubqV5w
April 1, 2024
30420
Europe & Central Asia
ECS
false
2
1
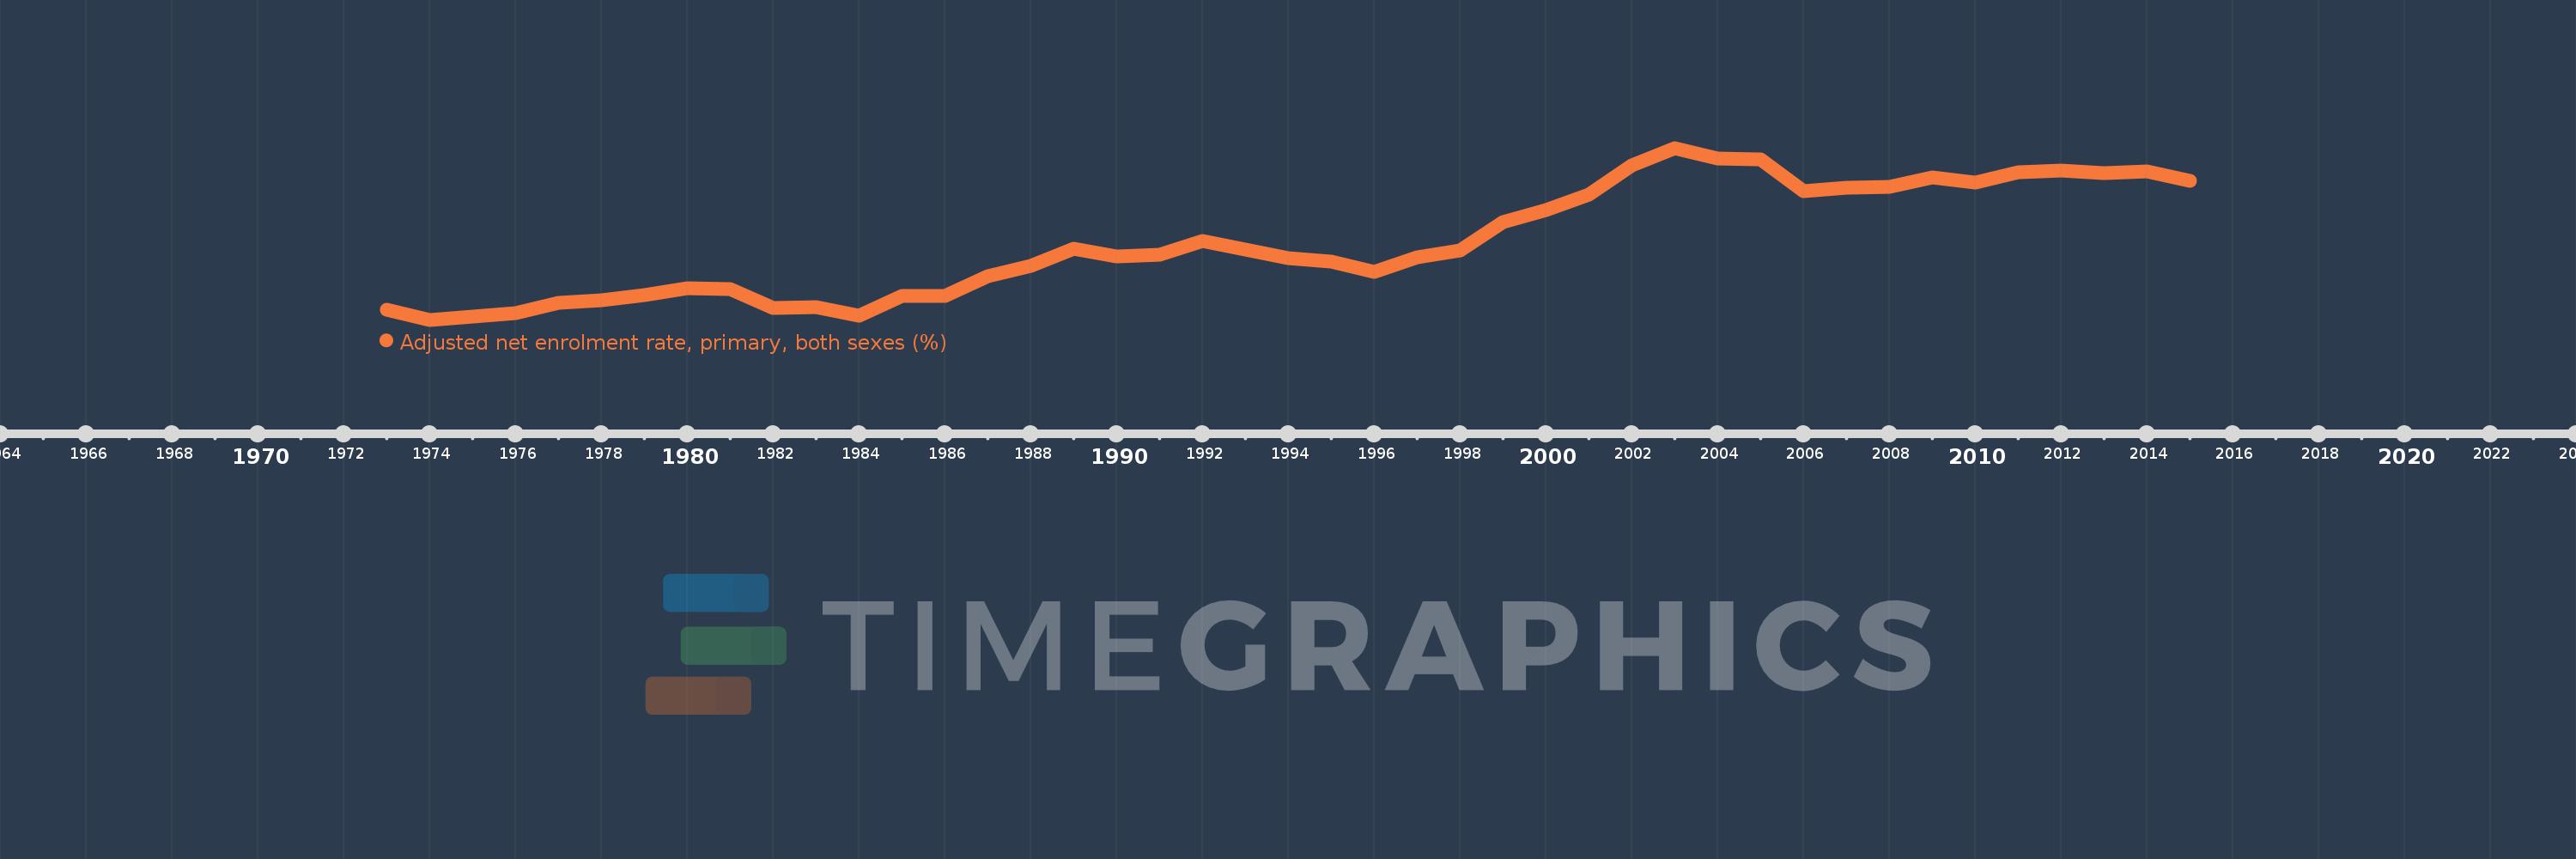
Adjusted net enrolment rate, primary, both sexes (%)
2015,2014,2013,2012,2011,2010,2009,2008,2007,2006,2005,2004,2003,2002,2001,2000,1999,1998,1997,1996,1995,1994,1993,1992,1991,1990,1989,1988,1987,1986,1985,1984,1983,1982,1981,1980,1979,1978,1977,1976,1975,1974,1973
This statistics in other country:
AfghanistanAlbaniaAlgeriaAngolaAntigua and BarbudaArab WorldArgentinaArmeniaArubaAustraliaAustriaAzerbaijanBahamas, TheBahrainBangladeshBarbadosBelarusBelgiumBelizeBeninBermudaBhutanBoliviaBosnia and HerzegovinaBotswanaBrazilBrunei DarussalamBulgariaBurkina FasoBurundiCabo VerdeCambodiaCameroonCanadaCaribbean small statesCentral African RepublicCentral Europe and the BalticsChadChileChinaColombiaComorosCongo, Dem. Rep.Congo, Rep.Costa RicaCote d'IvoireCroatiaCubaCyprusDenmarkDjiboutiDominicaDominican RepublicEarly-demographic dividendEast Asia & PacificEast Asia & Pacific (excluding high income)East Asia & Pacific (IDA & IBRD countries)EcuadorEgypt, Arab Rep.El SalvadorEquatorial GuineaEritreaEstoniaEthiopiaEuro areaEurope & Central AsiaEurope & Central Asia (excluding high income)Europe & Central Asia (IDA & IBRD countries)European UnionFijiFinlandFragile and conflict affected situationsFranceGabonGambia, TheGeorgiaGermanyGhanaGreeceGrenadaGuatemalaGuineaGuinea-BissauGuyanaHaitiHeavily indebted poor countries (HIPC)High incomeHondurasHong Kong SAR, ChinaHungaryIBRD onlyIcelandIDA & IBRD totalIDA blendIDA onlyIDA totalIndiaIndonesiaIran, Islamic Rep.IraqIrelandIsraelItalyJamaicaJapanJordanKazakhstanKenyaKiribatiKorea, Dem. People’s Rep.Korea, Rep.KuwaitKyrgyz RepublicLao PDRLate-demographic dividendLatin America & Caribbean Latin America & Caribbean (excluding high income)Latin America & the Caribbean (IDA & IBRD countries)LatviaLeast developed countries: UN classificationLebanonLesothoLiberiaLibyaLiechtensteinLithuaniaLow & middle incomeLow incomeLower middle incomeLuxembourgMacao SAR, ChinaMacedonia, FYRMadagascarMalawiMalaysiaMaldivesMaliMaltaMarshall IslandsMauritaniaMauritiusMexicoMicronesia, Fed. Sts.Middle East & North AfricaMiddle East & North Africa (excluding high income)Middle East & North Africa (IDA & IBRD countries)Middle incomeMoldovaMongoliaMontenegroMoroccoMozambiqueMyanmarNamibiaNauruNepalNetherlandsNew ZealandNicaraguaNigerNigeriaNorth AmericaNorwayOECD membersOmanOther small statesPacific island small statesPakistanPalauPanamaPapua New GuineaParaguayPeruPhilippinesPolandPortugalPost-demographic dividendPre-demographic dividendPuerto RicoQatarRomaniaRussian FederationRwandaSamoaSan MarinoSao Tome and PrincipeSaudi ArabiaSenegalSerbiaSeychellesSierra LeoneSloveniaSmall statesSolomon IslandsSomaliaSouth AfricaSouth AsiaSouth Asia (IDA & IBRD)South SudanSpainSri LankaSt. Kitts and NevisSt. LuciaSt. Vincent and the GrenadinesSub-Saharan Africa Sub-Saharan Africa (excluding high income)Sub-Saharan Africa (IDA & IBRD countries)SudanSurinameSwazilandSwedenSwitzerlandSyrian Arab RepublicTajikistanTanzaniaThailandTimor-LesteTogoTongaTrinidad and TobagoTunisiaTurkeyTuvaluUgandaUkraineUnited Arab EmiratesUnited KingdomUnited StatesUpper middle incomeUruguayUzbekistanVanuatuVenezuela, RBVietnamWest Bank and GazaWorldYemen, Rep.ZambiaZimbabwe Timeline:
This timeline shows a graph from 1973 to 2015 of Europe & Central Asia. No data until 1972. Number of actual observations by date: 43.
Source name:
World Development Indicators
Source organization:
UNESCO Institute for Statistics
Categories, topics:
Education
Last updated:
apr 23, 2017
Indicators value changes by year
Minimum:
93.055
jan 1, 1974
Maximum:
97.972
jan 1, 2003
At the date of observation
Value
Absolute change
Change from previous value
jan 1, 1973
93.335
+93.335
0.0%
jan 1, 1974
93.055
-0.281
-0.3%
jan 1, 1975
93.136
+0.081
0.09%
jan 1, 1976
93.236
+0.1
0.11%
jan 1, 1977
93.528
+0.292
0.31%
jan 1, 1978
93.614
+0.086
0.09%
jan 1, 1979
93.772
+0.158
0.17%
jan 1, 1980
93.959
+0.187
0.2%
jan 1, 1981
93.932
-0.027
-0.03%
jan 1, 1982
93.401
-0.531
-0.57%
jan 1, 1983
93.423
+0.022
0.02%
jan 1, 1984
93.169
-0.254
-0.27%
jan 1, 1985
93.742
+0.574
0.62%
jan 1, 1986
93.738
-0.005
-0.01%
jan 1, 1987
94.306
+0.569
0.61%
jan 1, 1988
94.605
+0.299
0.32%
jan 1, 1989
95.082
+0.477
0.5%
jan 1, 1990
94.864
-0.218
-0.23%
jan 1, 1991
94.924
+0.06
0.06%
jan 1, 1992
95.3
+0.377
0.4%
jan 1, 1993
95.054
-0.246
-0.26%
jan 1, 1994
94.814
-0.24
-0.25%
jan 1, 1995
94.708
-0.107
-0.11%
jan 1, 1996
94.434
-0.273
-0.29%
jan 1, 1997
94.84
+0.406
0.43%
jan 1, 1998
95.036
+0.196
0.21%
jan 1, 1999
95.853
+0.817
0.86%
jan 1, 2000
96.192
+0.339
0.35%
jan 1, 2001
96.648
+0.456
0.47%
jan 1, 2002
97.478
+0.83
0.86%
jan 1, 2003
97.972
+0.495
0.51%
jan 1, 2004
97.666
-0.306
-0.31%
jan 1, 2005
97.641
-0.026
-0.03%
jan 1, 2006
96.737
-0.904
-0.93%
jan 1, 2007
96.833
+0.096
0.1%
jan 1, 2008
96.863
+0.03
0.03%
jan 1, 2009
97.13
+0.267
0.28%
jan 1, 2010
96.981
-0.149
-0.15%
jan 1, 2011
97.275
+0.294
0.3%
jan 1, 2012
97.329
+0.054
0.06%
jan 1, 2013
97.25
-0.08
-0.08%
jan 1, 2014
97.306
+0.057
0.06%
jan 1, 2015
97.022
-0.284
-0.29%
Ranking of countries by current statistics by years


Comments: