29
/
en
AIzaSyAYiBZKx7MnpbEhh9jyipgxe19OcubqV5w
April 1, 2024
53899
Pacific island small states
PSS
false
2
1
Adjusted net enrolment rate, primary, both sexes (%)
2015,2014,2013,2012,2011,2010,2009,2008,2007,2006,2005,2004,2003,2002,2001,2000,1999,1998,1997,1996,1995,1994,1993,1992
This statistics in other country:
AfghanistanAlbaniaAlgeriaAngolaAntigua and BarbudaArab WorldArgentinaArmeniaArubaAustraliaAustriaAzerbaijanBahamas, TheBahrainBangladeshBarbadosBelarusBelgiumBelizeBeninBermudaBhutanBoliviaBosnia and HerzegovinaBotswanaBrazilBrunei DarussalamBulgariaBurkina FasoBurundiCabo VerdeCambodiaCameroonCanadaCaribbean small statesCentral African RepublicCentral Europe and the BalticsChadChileChinaColombiaComorosCongo, Dem. Rep.Congo, Rep.Costa RicaCote d'IvoireCroatiaCubaCyprusDenmarkDjiboutiDominicaDominican RepublicEarly-demographic dividendEast Asia & PacificEast Asia & Pacific (excluding high income)East Asia & Pacific (IDA & IBRD countries)EcuadorEgypt, Arab Rep.El SalvadorEquatorial GuineaEritreaEstoniaEthiopiaEuro areaEurope & Central AsiaEurope & Central Asia (excluding high income)Europe & Central Asia (IDA & IBRD countries)European UnionFijiFinlandFragile and conflict affected situationsFranceGabonGambia, TheGeorgiaGermanyGhanaGreeceGrenadaGuatemalaGuineaGuinea-BissauGuyanaHaitiHeavily indebted poor countries (HIPC)High incomeHondurasHong Kong SAR, ChinaHungaryIBRD onlyIcelandIDA & IBRD totalIDA blendIDA onlyIDA totalIndiaIndonesiaIran, Islamic Rep.IraqIrelandIsraelItalyJamaicaJapanJordanKazakhstanKenyaKiribatiKorea, Dem. People’s Rep.Korea, Rep.KuwaitKyrgyz RepublicLao PDRLate-demographic dividendLatin America & Caribbean Latin America & Caribbean (excluding high income)Latin America & the Caribbean (IDA & IBRD countries)LatviaLeast developed countries: UN classificationLebanonLesothoLiberiaLibyaLiechtensteinLithuaniaLow & middle incomeLow incomeLower middle incomeLuxembourgMacao SAR, ChinaMacedonia, FYRMadagascarMalawiMalaysiaMaldivesMaliMaltaMarshall IslandsMauritaniaMauritiusMexicoMicronesia, Fed. Sts.Middle East & North AfricaMiddle East & North Africa (excluding high income)Middle East & North Africa (IDA & IBRD countries)Middle incomeMoldovaMongoliaMontenegroMoroccoMozambiqueMyanmarNamibiaNauruNepalNetherlandsNew ZealandNicaraguaNigerNigeriaNorth AmericaNorwayOECD membersOmanOther small statesPacific island small statesPakistanPalauPanamaPapua New GuineaParaguayPeruPhilippinesPolandPortugalPost-demographic dividendPre-demographic dividendPuerto RicoQatarRomaniaRussian FederationRwandaSamoaSan MarinoSao Tome and PrincipeSaudi ArabiaSenegalSerbiaSeychellesSierra LeoneSloveniaSmall statesSolomon IslandsSomaliaSouth AfricaSouth AsiaSouth Asia (IDA & IBRD)South SudanSpainSri LankaSt. Kitts and NevisSt. LuciaSt. Vincent and the GrenadinesSub-Saharan Africa Sub-Saharan Africa (excluding high income)Sub-Saharan Africa (IDA & IBRD countries)SudanSurinameSwazilandSwedenSwitzerlandSyrian Arab RepublicTajikistanTanzaniaThailandTimor-LesteTogoTongaTrinidad and TobagoTunisiaTurkeyTuvaluUgandaUkraineUnited Arab EmiratesUnited KingdomUnited StatesUpper middle incomeUruguayUzbekistanVanuatuVenezuela, RBVietnamWest Bank and GazaWorldYemen, Rep.ZambiaZimbabwe Timeline:
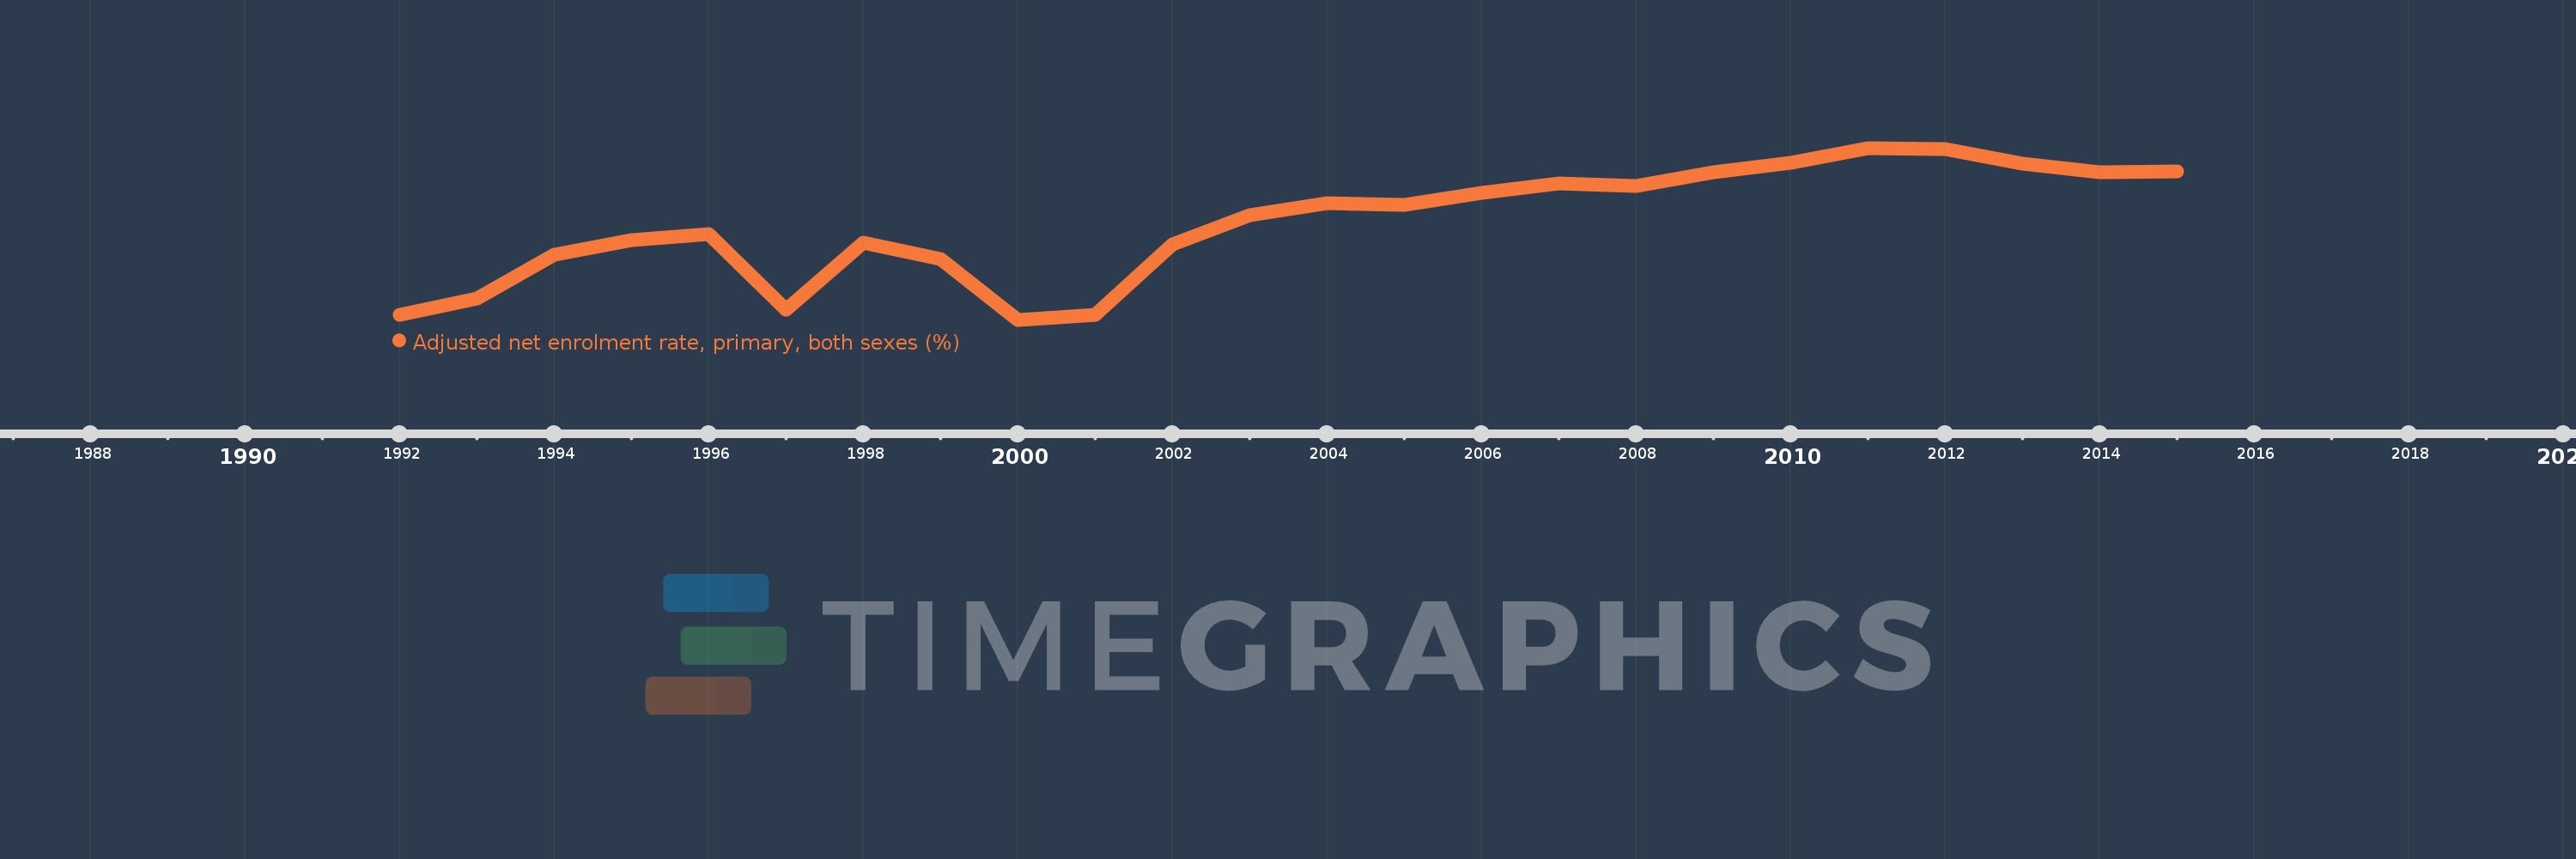
This timeline shows a graph from 1992 to 2015 of Pacific island small states. No data until 1991. Number of actual observations by date: 24.
Source name:
World Development Indicators
Source organization:
UNESCO Institute for Statistics
Categories, topics:
Education
Last updated:
apr 23, 2017
Indicators value changes by year
Minimum:
87.712
jan 1, 2000
Maximum:
94.782
jan 1, 2011
At the date of observation
Value
Absolute change
Change from previous value
jan 1, 1992
87.907
+87.907
0.0%
jan 1, 1993
88.594
+0.687
0.78%
jan 1, 1994
90.386
+1.791
2.02%
jan 1, 1995
90.975
+0.59
0.65%
jan 1, 1996
91.239
+0.263
0.29%
jan 1, 1997
88.135
-3.103
-3.4%
jan 1, 1998
90.887
+2.752
3.12%
jan 1, 1999
90.225
-0.662
-0.73%
jan 1, 2000
87.712
-2.514
-2.79%
jan 1, 2001
87.914
+0.202
0.23%
jan 1, 2002
90.822
+2.909
3.31%
jan 1, 2003
92.03
+1.208
1.33%
jan 1, 2004
92.519
+0.489
0.53%
jan 1, 2005
92.425
-0.094
-0.1%
jan 1, 2006
92.917
+0.491
0.53%
jan 1, 2007
93.322
+0.405
0.44%
jan 1, 2008
93.23
-0.092
-0.1%
jan 1, 2009
93.789
+0.56
0.6%
jan 1, 2010
94.182
+0.393
0.42%
jan 1, 2011
94.782
+0.6
0.64%
jan 1, 2012
94.747
-0.036
-0.04%
jan 1, 2013
94.146
-0.6
-0.63%
jan 1, 2014
93.781
-0.366
-0.39%
jan 1, 2015
93.832
+0.051
0.05%
Ranking of countries by current statistics by years


Comments: