29
/
en
AIzaSyAYiBZKx7MnpbEhh9jyipgxe19OcubqV5w
April 1, 2024
159094
Ireland
IRL
true
2
1
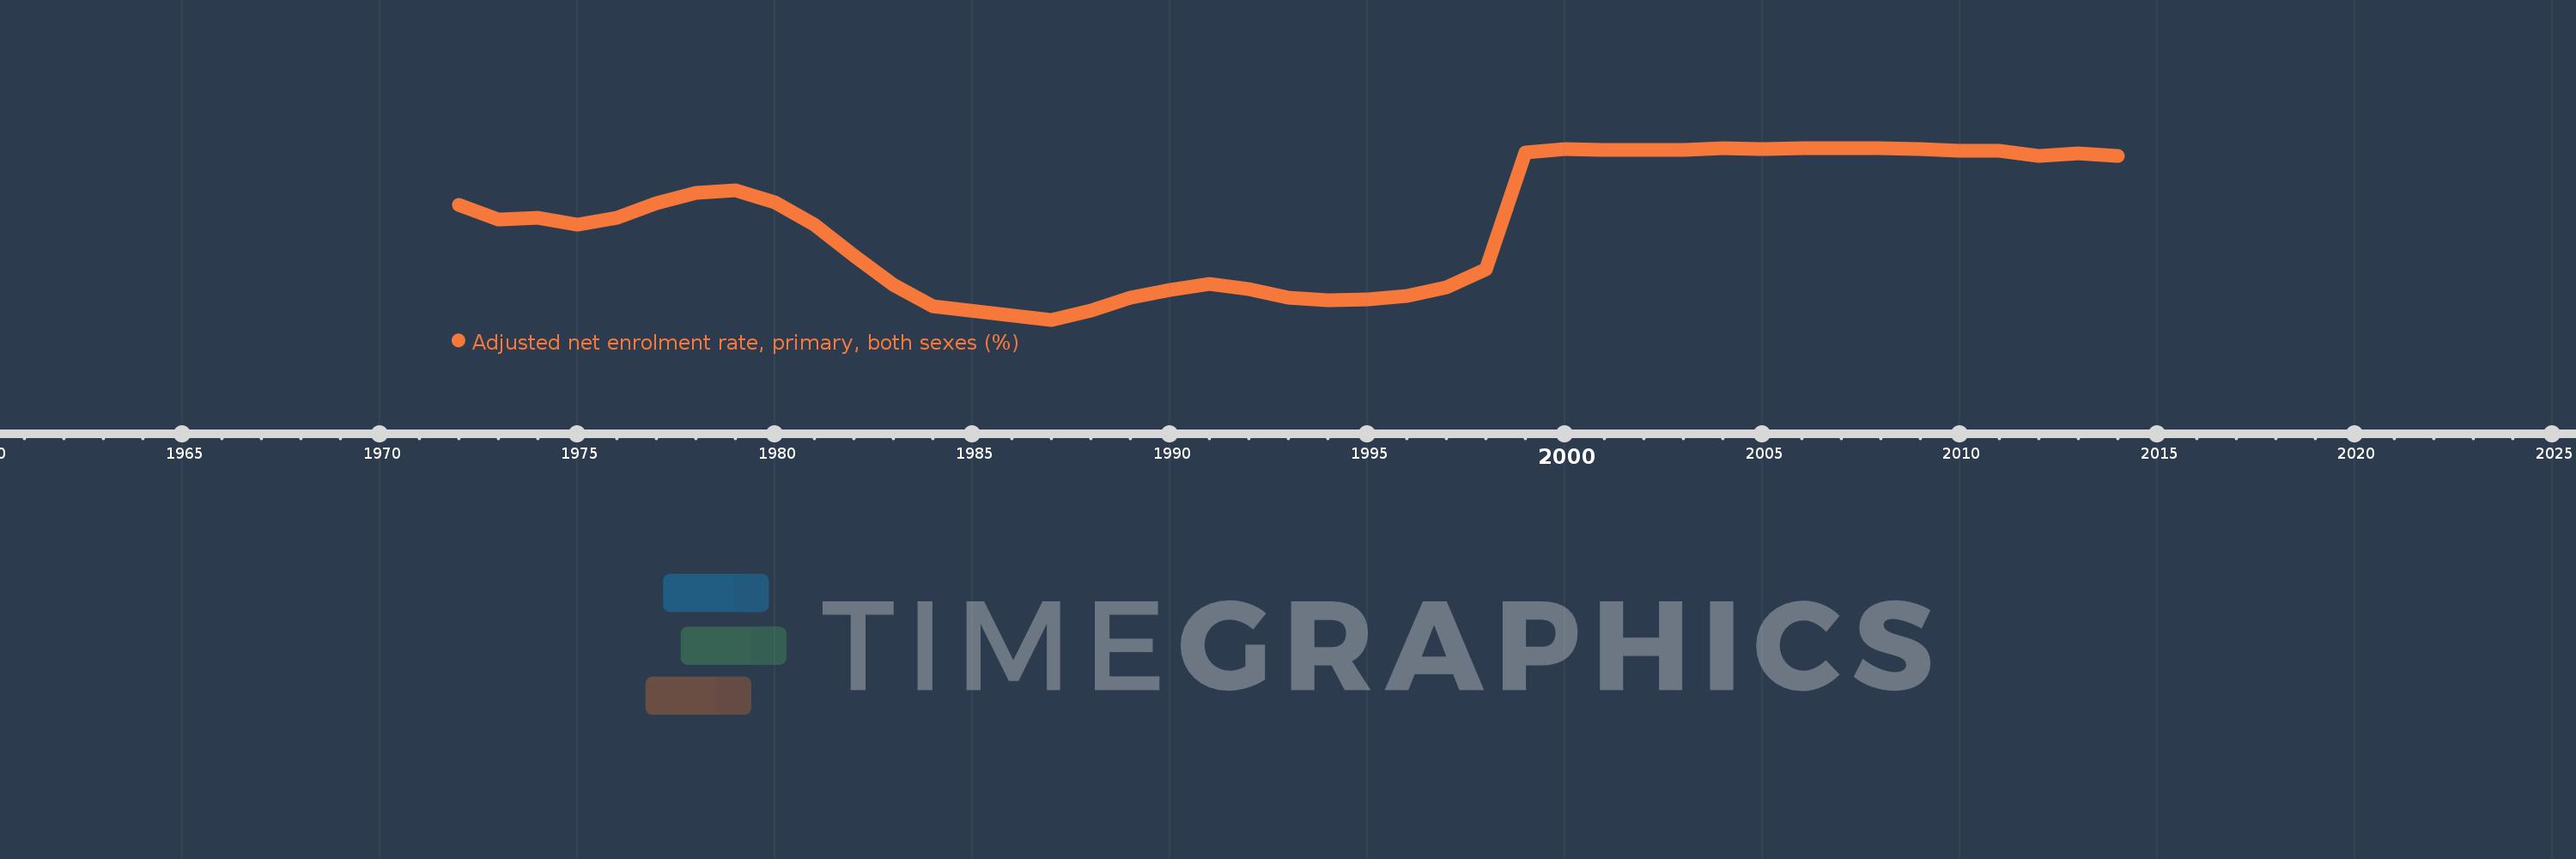
Adjusted net enrolment rate, primary, both sexes (%)
2014,2013,2012,2011,2010,2009,2008,2007,2006,2005,2004,2003,2002,2001,2000,1999,1998,1997,1996,1995,1994,1993,1992,1991,1990,1989,1988,1987,1984,1983,1982,1981,1980,1979,1978,1977,1976,1975,1974,1973,1972
This statistics in other country:
AfghanistanAlbaniaAlgeriaAngolaAntigua and BarbudaArab WorldArgentinaArmeniaArubaAustraliaAustriaAzerbaijanBahamas, TheBahrainBangladeshBarbadosBelarusBelgiumBelizeBeninBermudaBhutanBoliviaBosnia and HerzegovinaBotswanaBrazilBrunei DarussalamBulgariaBurkina FasoBurundiCabo VerdeCambodiaCameroonCanadaCaribbean small statesCentral African RepublicCentral Europe and the BalticsChadChileChinaColombiaComorosCongo, Dem. Rep.Congo, Rep.Costa RicaCote d'IvoireCroatiaCubaCyprusDenmarkDjiboutiDominicaDominican RepublicEarly-demographic dividendEast Asia & PacificEast Asia & Pacific (excluding high income)East Asia & Pacific (IDA & IBRD countries)EcuadorEgypt, Arab Rep.El SalvadorEquatorial GuineaEritreaEstoniaEthiopiaEuro areaEurope & Central AsiaEurope & Central Asia (excluding high income)Europe & Central Asia (IDA & IBRD countries)European UnionFijiFinlandFragile and conflict affected situationsFranceGabonGambia, TheGeorgiaGermanyGhanaGreeceGrenadaGuatemalaGuineaGuinea-BissauGuyanaHaitiHeavily indebted poor countries (HIPC)High incomeHondurasHong Kong SAR, ChinaHungaryIBRD onlyIcelandIDA & IBRD totalIDA blendIDA onlyIDA totalIndiaIndonesiaIran, Islamic Rep.IraqIrelandIsraelItalyJamaicaJapanJordanKazakhstanKenyaKiribatiKorea, Dem. People’s Rep.Korea, Rep.KuwaitKyrgyz RepublicLao PDRLate-demographic dividendLatin America & Caribbean Latin America & Caribbean (excluding high income)Latin America & the Caribbean (IDA & IBRD countries)LatviaLeast developed countries: UN classificationLebanonLesothoLiberiaLibyaLiechtensteinLithuaniaLow & middle incomeLow incomeLower middle incomeLuxembourgMacao SAR, ChinaMacedonia, FYRMadagascarMalawiMalaysiaMaldivesMaliMaltaMarshall IslandsMauritaniaMauritiusMexicoMicronesia, Fed. Sts.Middle East & North AfricaMiddle East & North Africa (excluding high income)Middle East & North Africa (IDA & IBRD countries)Middle incomeMoldovaMongoliaMontenegroMoroccoMozambiqueMyanmarNamibiaNauruNepalNetherlandsNew ZealandNicaraguaNigerNigeriaNorth AmericaNorwayOECD membersOmanOther small statesPacific island small statesPakistanPalauPanamaPapua New GuineaParaguayPeruPhilippinesPolandPortugalPost-demographic dividendPre-demographic dividendPuerto RicoQatarRomaniaRussian FederationRwandaSamoaSan MarinoSao Tome and PrincipeSaudi ArabiaSenegalSerbiaSeychellesSierra LeoneSloveniaSmall statesSolomon IslandsSomaliaSouth AfricaSouth AsiaSouth Asia (IDA & IBRD)South SudanSpainSri LankaSt. Kitts and NevisSt. LuciaSt. Vincent and the GrenadinesSub-Saharan Africa Sub-Saharan Africa (excluding high income)Sub-Saharan Africa (IDA & IBRD countries)SudanSurinameSwazilandSwedenSwitzerlandSyrian Arab RepublicTajikistanTanzaniaThailandTimor-LesteTogoTongaTrinidad and TobagoTunisiaTurkeyTuvaluUgandaUkraineUnited Arab EmiratesUnited KingdomUnited StatesUpper middle incomeUruguayUzbekistanVanuatuVenezuela, RBVietnamWest Bank and GazaWorldYemen, Rep.ZambiaZimbabwe Timeline:
This timeline shows a graph from 1972 to 2014 of Ireland. No data until 1971. Number of actual observations by date: 41.
Source name:
World Development Indicators
Source organization:
UNESCO Institute for Statistics
Categories, topics:
Education
Last updated:
apr 23, 2017
Indicators value changes by year
Minimum:
84.842
jan 1, 1987
Maximum:
99.924
jan 1, 2008
At the date of observation
Value
Absolute change
Change from previous value
jan 1, 1972
94.892
+94.892
0.0%
jan 1, 1973
93.631
-1.261
-1.33%
jan 1, 1974
93.815
+0.183
0.2%
jan 1, 1975
93.153
-0.661
-0.71%
jan 1, 1976
93.817
+0.664
0.71%
jan 1, 1977
95.066
+1.25
1.33%
jan 1, 1978
95.984
+0.917
0.97%
jan 1, 1979
96.216
+0.232
0.24%
jan 1, 1980
95.17
-1.046
-1.09%
jan 1, 1981
93.219
-1.951
-2.05%
jan 1, 1982
90.495
-2.723
-2.92%
jan 1, 1983
87.893
-2.602
-2.88%
jan 1, 1984
86.028
-1.866
-2.12%
jan 1, 1987
84.842
-1.185
-1.38%
jan 1, 1988
85.668
+0.826
0.97%
jan 1, 1989
86.777
+1.109
1.29%
jan 1, 1990
87.437
+0.66
0.76%
jan 1, 1991
87.972
+0.535
0.61%
jan 1, 1992
87.552
-0.42
-0.48%
jan 1, 1993
86.791
-0.761
-0.87%
jan 1, 1994
86.535
-0.256
-0.29%
jan 1, 1995
86.646
+0.111
0.13%
jan 1, 1996
86.925
+0.279
0.32%
jan 1, 1997
87.663
+0.738
0.85%
jan 1, 1998
89.265
+1.602
1.83%
jan 1, 1999
99.536
+10.271
11.51%
jan 1, 2000
99.815
+0.279
0.28%
jan 1, 2001
99.754
-0.06
-0.06%
jan 1, 2002
99.723
-0.031
-0.03%
jan 1, 2003
99.768
+0.045
0.04%
jan 1, 2004
99.893
+0.125
0.13%
jan 1, 2005
99.802
-0.09
-0.09%
jan 1, 2006
99.875
+0.072
0.07%
jan 1, 2007
99.89
+0.015
0.02%
jan 1, 2008
99.924
+0.034
0.03%
jan 1, 2009
99.819
-0.105
-0.1%
jan 1, 2010
99.689
-0.131
-0.13%
jan 1, 2011
99.666
-0.023
-0.02%
jan 1, 2012
99.253
-0.413
-0.41%
jan 1, 2013
99.432
+0.179
0.18%
jan 1, 2014
99.24
-0.192
-0.19%
Ranking of countries by current statistics by years


Comments: