29
/
en
AIzaSyAYiBZKx7MnpbEhh9jyipgxe19OcubqV5w
April 1, 2024
49758
Middle East & North Africa (IDA & IBRD countries)
TMN
false
2
1
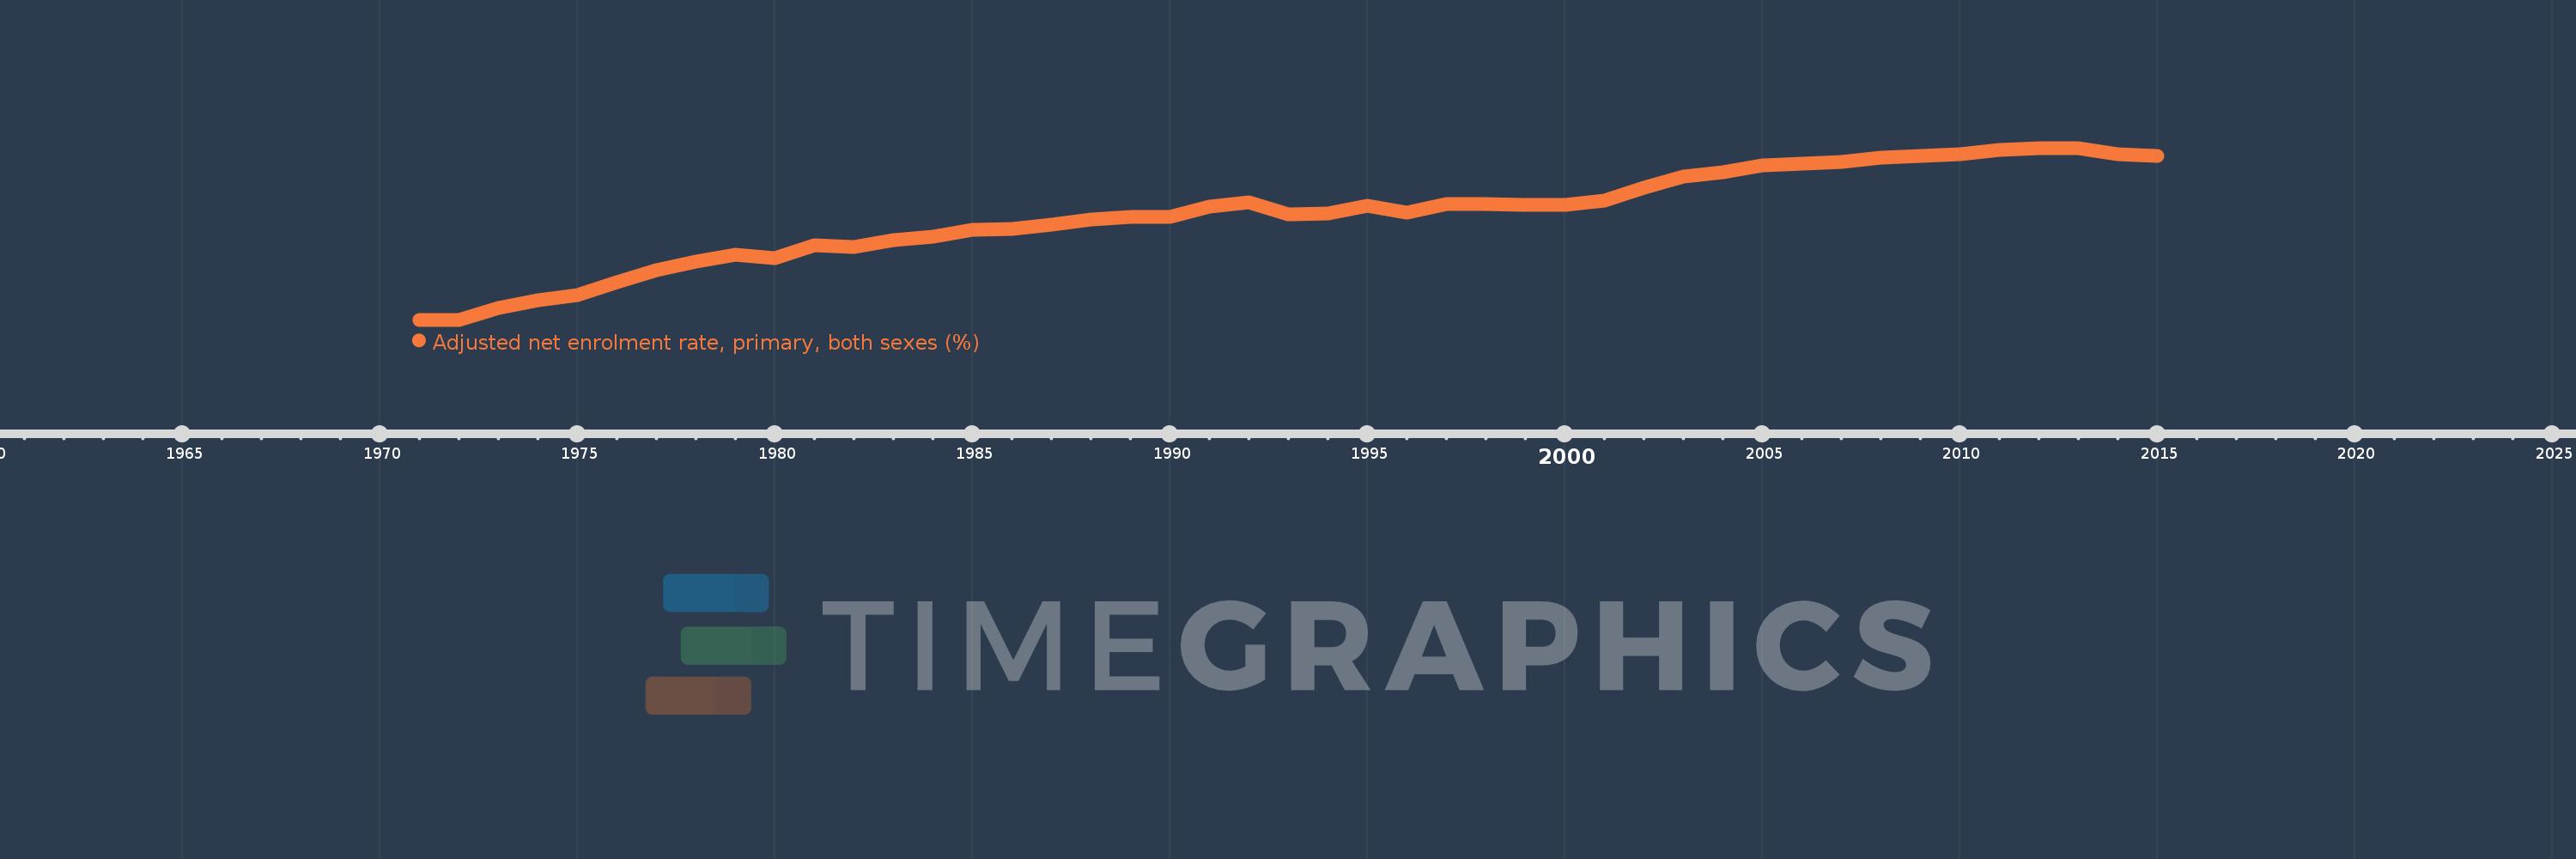
Adjusted net enrolment rate, primary, both sexes (%)
2015,2014,2013,2012,2011,2010,2009,2008,2007,2006,2005,2004,2003,2002,2001,2000,1999,1998,1997,1996,1995,1994,1993,1992,1991,1990,1989,1988,1987,1986,1985,1984,1983,1982,1981,1980,1979,1978,1977,1976,1975,1974,1973,1972,1971
This statistics in other country:
AfghanistanAlbaniaAlgeriaAngolaAntigua and BarbudaArab WorldArgentinaArmeniaArubaAustraliaAustriaAzerbaijanBahamas, TheBahrainBangladeshBarbadosBelarusBelgiumBelizeBeninBermudaBhutanBoliviaBosnia and HerzegovinaBotswanaBrazilBrunei DarussalamBulgariaBurkina FasoBurundiCabo VerdeCambodiaCameroonCanadaCaribbean small statesCentral African RepublicCentral Europe and the BalticsChadChileChinaColombiaComorosCongo, Dem. Rep.Congo, Rep.Costa RicaCote d'IvoireCroatiaCubaCyprusDenmarkDjiboutiDominicaDominican RepublicEarly-demographic dividendEast Asia & PacificEast Asia & Pacific (excluding high income)East Asia & Pacific (IDA & IBRD countries)EcuadorEgypt, Arab Rep.El SalvadorEquatorial GuineaEritreaEstoniaEthiopiaEuro areaEurope & Central AsiaEurope & Central Asia (excluding high income)Europe & Central Asia (IDA & IBRD countries)European UnionFijiFinlandFragile and conflict affected situationsFranceGabonGambia, TheGeorgiaGermanyGhanaGreeceGrenadaGuatemalaGuineaGuinea-BissauGuyanaHaitiHeavily indebted poor countries (HIPC)High incomeHondurasHong Kong SAR, ChinaHungaryIBRD onlyIcelandIDA & IBRD totalIDA blendIDA onlyIDA totalIndiaIndonesiaIran, Islamic Rep.IraqIrelandIsraelItalyJamaicaJapanJordanKazakhstanKenyaKiribatiKorea, Dem. People’s Rep.Korea, Rep.KuwaitKyrgyz RepublicLao PDRLate-demographic dividendLatin America & Caribbean Latin America & Caribbean (excluding high income)Latin America & the Caribbean (IDA & IBRD countries)LatviaLeast developed countries: UN classificationLebanonLesothoLiberiaLibyaLiechtensteinLithuaniaLow & middle incomeLow incomeLower middle incomeLuxembourgMacao SAR, ChinaMacedonia, FYRMadagascarMalawiMalaysiaMaldivesMaliMaltaMarshall IslandsMauritaniaMauritiusMexicoMicronesia, Fed. Sts.Middle East & North AfricaMiddle East & North Africa (excluding high income)Middle East & North Africa (IDA & IBRD countries)Middle incomeMoldovaMongoliaMontenegroMoroccoMozambiqueMyanmarNamibiaNauruNepalNetherlandsNew ZealandNicaraguaNigerNigeriaNorth AmericaNorwayOECD membersOmanOther small statesPacific island small statesPakistanPalauPanamaPapua New GuineaParaguayPeruPhilippinesPolandPortugalPost-demographic dividendPre-demographic dividendPuerto RicoQatarRomaniaRussian FederationRwandaSamoaSan MarinoSao Tome and PrincipeSaudi ArabiaSenegalSerbiaSeychellesSierra LeoneSloveniaSmall statesSolomon IslandsSomaliaSouth AfricaSouth AsiaSouth Asia (IDA & IBRD)South SudanSpainSri LankaSt. Kitts and NevisSt. LuciaSt. Vincent and the GrenadinesSub-Saharan Africa Sub-Saharan Africa (excluding high income)Sub-Saharan Africa (IDA & IBRD countries)SudanSurinameSwazilandSwedenSwitzerlandSyrian Arab RepublicTajikistanTanzaniaThailandTimor-LesteTogoTongaTrinidad and TobagoTunisiaTurkeyTuvaluUgandaUkraineUnited Arab EmiratesUnited KingdomUnited StatesUpper middle incomeUruguayUzbekistanVanuatuVenezuela, RBVietnamWest Bank and GazaWorldYemen, Rep.ZambiaZimbabwe Timeline:
This timeline shows a graph from 1971 to 2015 of Middle East & North Africa (IDA & IBRD countries). No data until 1970. Number of actual observations by date: 45.
Source name:
World Development Indicators
Source organization:
UNESCO Institute for Statistics
Categories, topics:
Education
Last updated:
apr 23, 2017
Indicators value changes by year
Minimum:
60.681
jan 1, 1972
Maximum:
95.962
jan 1, 2013
At the date of observation
Value
Absolute change
Change from previous value
jan 1, 1971
60.693
+60.693
0.0%
jan 1, 1972
60.681
-0.012
-0.02%
jan 1, 1973
63.122
+2.441
4.02%
jan 1, 1974
64.61
+1.488
2.36%
jan 1, 1975
65.69
+1.08
1.67%
jan 1, 1976
68.399
+2.709
4.12%
jan 1, 1977
70.943
+2.544
3.72%
jan 1, 1978
72.596
+1.652
2.33%
jan 1, 1979
73.962
+1.366
1.88%
jan 1, 1980
73.335
-0.627
-0.85%
jan 1, 1981
75.941
+2.606
3.55%
jan 1, 1982
75.649
-0.292
-0.38%
jan 1, 1983
76.985
+1.336
1.77%
jan 1, 1984
77.738
+0.752
0.98%
jan 1, 1985
79.069
+1.331
1.71%
jan 1, 1986
79.398
+0.33
0.42%
jan 1, 1987
80.251
+0.853
1.07%
jan 1, 1988
81.217
+0.966
1.2%
jan 1, 1989
81.884
+0.667
0.82%
jan 1, 1990
81.811
-0.073
-0.09%
jan 1, 1991
83.863
+2.052
2.51%
jan 1, 1992
84.802
+0.939
1.12%
jan 1, 1993
82.289
-2.513
-2.96%
jan 1, 1994
82.437
+0.148
0.18%
jan 1, 1995
84.063
+1.627
1.97%
jan 1, 1996
82.726
-1.338
-1.59%
jan 1, 1997
84.527
+1.801
2.18%
jan 1, 1998
84.447
-0.08
-0.09%
jan 1, 1999
84.283
-0.164
-0.19%
jan 1, 2000
84.306
+0.023
0.03%
jan 1, 2001
85.206
+0.9
1.07%
jan 1, 2002
87.865
+2.659
3.12%
jan 1, 2003
90.064
+2.198
2.5%
jan 1, 2004
90.957
+0.893
0.99%
jan 1, 2005
92.316
+1.36
1.49%
jan 1, 2006
92.783
+0.466
0.51%
jan 1, 2007
93.049
+0.267
0.29%
jan 1, 2008
93.925
+0.875
0.94%
jan 1, 2009
94.257
+0.332
0.35%
jan 1, 2010
94.637
+0.381
0.4%
jan 1, 2011
95.519
+0.882
0.93%
jan 1, 2012
95.836
+0.317
0.33%
jan 1, 2013
95.962
+0.126
0.13%
jan 1, 2014
94.76
-1.202
-1.25%
jan 1, 2015
94.318
-0.442
-0.47%
Ranking of countries by current statistics by years


Comments: