29
/
en
AIzaSyAYiBZKx7MnpbEhh9jyipgxe19OcubqV5w
April 1, 2024
44011
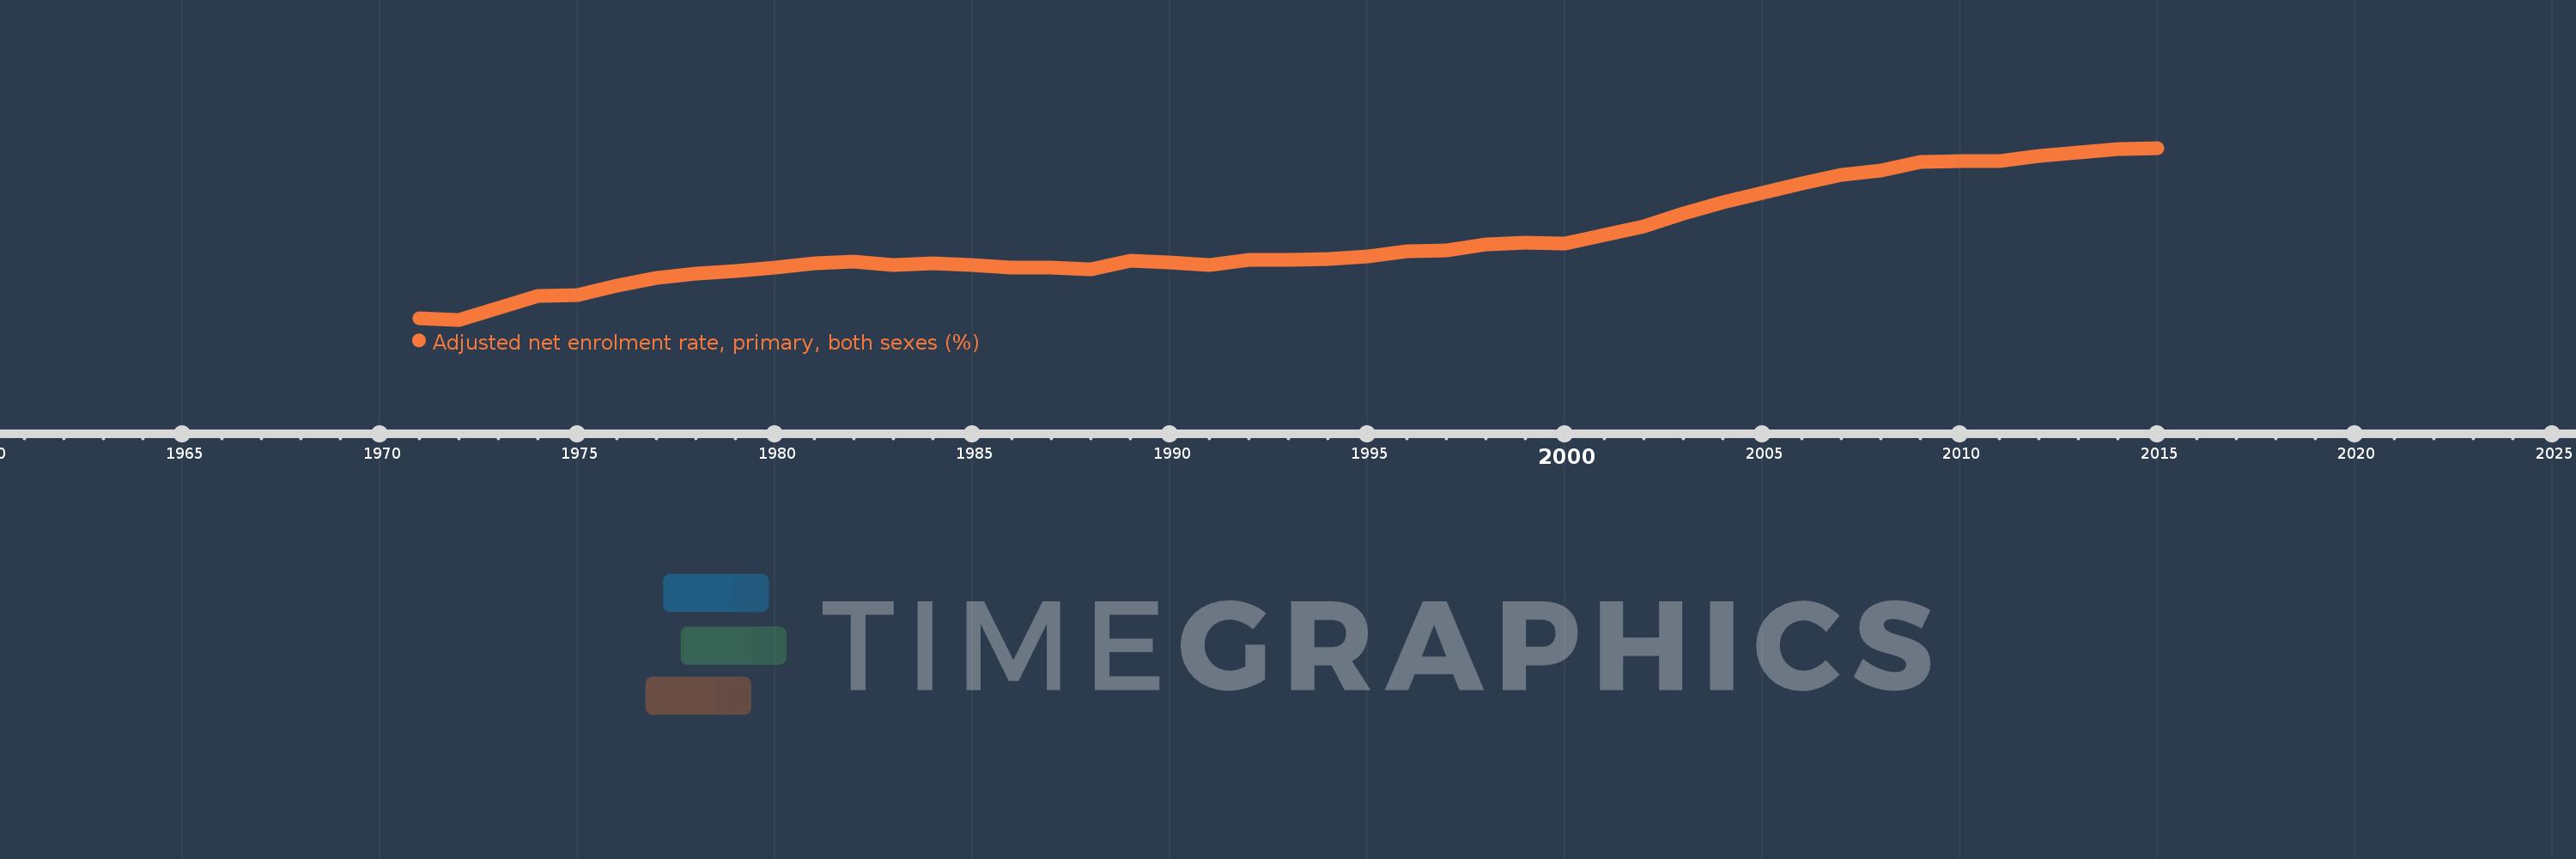
Least developed countries: UN classification
LDC
false
2
1
Adjusted net enrolment rate, primary, both sexes (%)
2015,2014,2013,2012,2011,2010,2009,2008,2007,2006,2005,2004,2003,2002,2001,2000,1999,1998,1997,1996,1995,1994,1993,1992,1991,1990,1989,1988,1987,1986,1985,1984,1983,1982,1981,1980,1979,1978,1977,1976,1975,1974,1973,1972,1971
This statistics in other country:
AfghanistanAlbaniaAlgeriaAngolaAntigua and BarbudaArab WorldArgentinaArmeniaArubaAustraliaAustriaAzerbaijanBahamas, TheBahrainBangladeshBarbadosBelarusBelgiumBelizeBeninBermudaBhutanBoliviaBosnia and HerzegovinaBotswanaBrazilBrunei DarussalamBulgariaBurkina FasoBurundiCabo VerdeCambodiaCameroonCanadaCaribbean small statesCentral African RepublicCentral Europe and the BalticsChadChileChinaColombiaComorosCongo, Dem. Rep.Congo, Rep.Costa RicaCote d'IvoireCroatiaCubaCyprusDenmarkDjiboutiDominicaDominican RepublicEarly-demographic dividendEast Asia & PacificEast Asia & Pacific (excluding high income)East Asia & Pacific (IDA & IBRD countries)EcuadorEgypt, Arab Rep.El SalvadorEquatorial GuineaEritreaEstoniaEthiopiaEuro areaEurope & Central AsiaEurope & Central Asia (excluding high income)Europe & Central Asia (IDA & IBRD countries)European UnionFijiFinlandFragile and conflict affected situationsFranceGabonGambia, TheGeorgiaGermanyGhanaGreeceGrenadaGuatemalaGuineaGuinea-BissauGuyanaHaitiHeavily indebted poor countries (HIPC)High incomeHondurasHong Kong SAR, ChinaHungaryIBRD onlyIcelandIDA & IBRD totalIDA blendIDA onlyIDA totalIndiaIndonesiaIran, Islamic Rep.IraqIrelandIsraelItalyJamaicaJapanJordanKazakhstanKenyaKiribatiKorea, Dem. People’s Rep.Korea, Rep.KuwaitKyrgyz RepublicLao PDRLate-demographic dividendLatin America & Caribbean Latin America & Caribbean (excluding high income)Latin America & the Caribbean (IDA & IBRD countries)LatviaLeast developed countries: UN classificationLebanonLesothoLiberiaLibyaLiechtensteinLithuaniaLow & middle incomeLow incomeLower middle incomeLuxembourgMacao SAR, ChinaMacedonia, FYRMadagascarMalawiMalaysiaMaldivesMaliMaltaMarshall IslandsMauritaniaMauritiusMexicoMicronesia, Fed. Sts.Middle East & North AfricaMiddle East & North Africa (excluding high income)Middle East & North Africa (IDA & IBRD countries)Middle incomeMoldovaMongoliaMontenegroMoroccoMozambiqueMyanmarNamibiaNauruNepalNetherlandsNew ZealandNicaraguaNigerNigeriaNorth AmericaNorwayOECD membersOmanOther small statesPacific island small statesPakistanPalauPanamaPapua New GuineaParaguayPeruPhilippinesPolandPortugalPost-demographic dividendPre-demographic dividendPuerto RicoQatarRomaniaRussian FederationRwandaSamoaSan MarinoSao Tome and PrincipeSaudi ArabiaSenegalSerbiaSeychellesSierra LeoneSloveniaSmall statesSolomon IslandsSomaliaSouth AfricaSouth AsiaSouth Asia (IDA & IBRD)South SudanSpainSri LankaSt. Kitts and NevisSt. LuciaSt. Vincent and the GrenadinesSub-Saharan Africa Sub-Saharan Africa (excluding high income)Sub-Saharan Africa (IDA & IBRD countries)SudanSurinameSwazilandSwedenSwitzerlandSyrian Arab RepublicTajikistanTanzaniaThailandTimor-LesteTogoTongaTrinidad and TobagoTunisiaTurkeyTuvaluUgandaUkraineUnited Arab EmiratesUnited KingdomUnited StatesUpper middle incomeUruguayUzbekistanVanuatuVenezuela, RBVietnamWest Bank and GazaWorldYemen, Rep.ZambiaZimbabwe Timeline:
This timeline shows a graph from 1971 to 2015 of Least developed countries: UN classification. No data until 1970. Number of actual observations by date: 45.
Source name:
World Development Indicators
Source organization:
UNESCO Institute for Statistics
Categories, topics:
Education
Last updated:
apr 23, 2017
Indicators value changes by year
Minimum:
38.445
jan 1, 1972
Maximum:
82.527
jan 1, 2015
At the date of observation
Value
Absolute change
Change from previous value
jan 1, 1971
38.799
+38.799
0.0%
jan 1, 1972
38.445
-0.355
-0.91%
jan 1, 1973
41.519
+3.074
8.0%
jan 1, 1974
44.632
+3.113
7.5%
jan 1, 1975
44.679
+0.047
0.1%
jan 1, 1976
47.151
+2.472
5.53%
jan 1, 1977
49.25
+2.099
4.45%
jan 1, 1978
50.175
+0.925
1.88%
jan 1, 1979
51.028
+0.854
1.7%
jan 1, 1980
51.821
+0.793
1.55%
jan 1, 1981
53.005
+1.184
2.28%
jan 1, 1982
53.268
+0.263
0.5%
jan 1, 1983
52.509
-0.759
-1.42%
jan 1, 1984
52.869
+0.359
0.68%
jan 1, 1985
52.509
-0.36
-0.68%
jan 1, 1986
51.796
-0.713
-1.36%
jan 1, 1987
51.821
+0.025
0.05%
jan 1, 1988
51.45
-0.371
-0.72%
jan 1, 1989
53.501
+2.051
3.99%
jan 1, 1990
53.147
-0.354
-0.66%
jan 1, 1991
52.566
-0.581
-1.09%
jan 1, 1992
53.891
+1.325
2.52%
jan 1, 1993
53.852
-0.04
-0.07%
jan 1, 1994
53.923
+0.071
0.13%
jan 1, 1995
54.734
+0.811
1.5%
jan 1, 1996
56.068
+1.334
2.44%
jan 1, 1997
56.184
+0.116
0.21%
jan 1, 1998
57.826
+1.642
2.92%
jan 1, 1999
58.187
+0.361
0.63%
jan 1, 2000
58.011
-0.176
-0.3%
jan 1, 2001
60.224
+2.213
3.81%
jan 1, 2002
62.44
+2.216
3.68%
jan 1, 2003
65.606
+3.165
5.07%
jan 1, 2004
68.557
+2.951
4.5%
jan 1, 2005
70.975
+2.418
3.53%
jan 1, 2006
73.414
+2.439
3.44%
jan 1, 2007
75.576
+2.162
2.95%
jan 1, 2008
76.79
+1.214
1.61%
jan 1, 2009
78.851
+2.061
2.68%
jan 1, 2010
79.197
+0.346
0.44%
jan 1, 2011
79.065
-0.132
-0.17%
jan 1, 2012
80.583
+1.518
1.92%
jan 1, 2013
81.454
+0.871
1.08%
jan 1, 2014
82.26
+0.806
0.99%
jan 1, 2015
82.527
+0.268
0.33%
Ranking of countries by current statistics by years


Comments: