29
/
en
AIzaSyAYiBZKx7MnpbEhh9jyipgxe19OcubqV5w
April 1, 2024
41182
Latin America & Caribbean
LCN
false
2
1
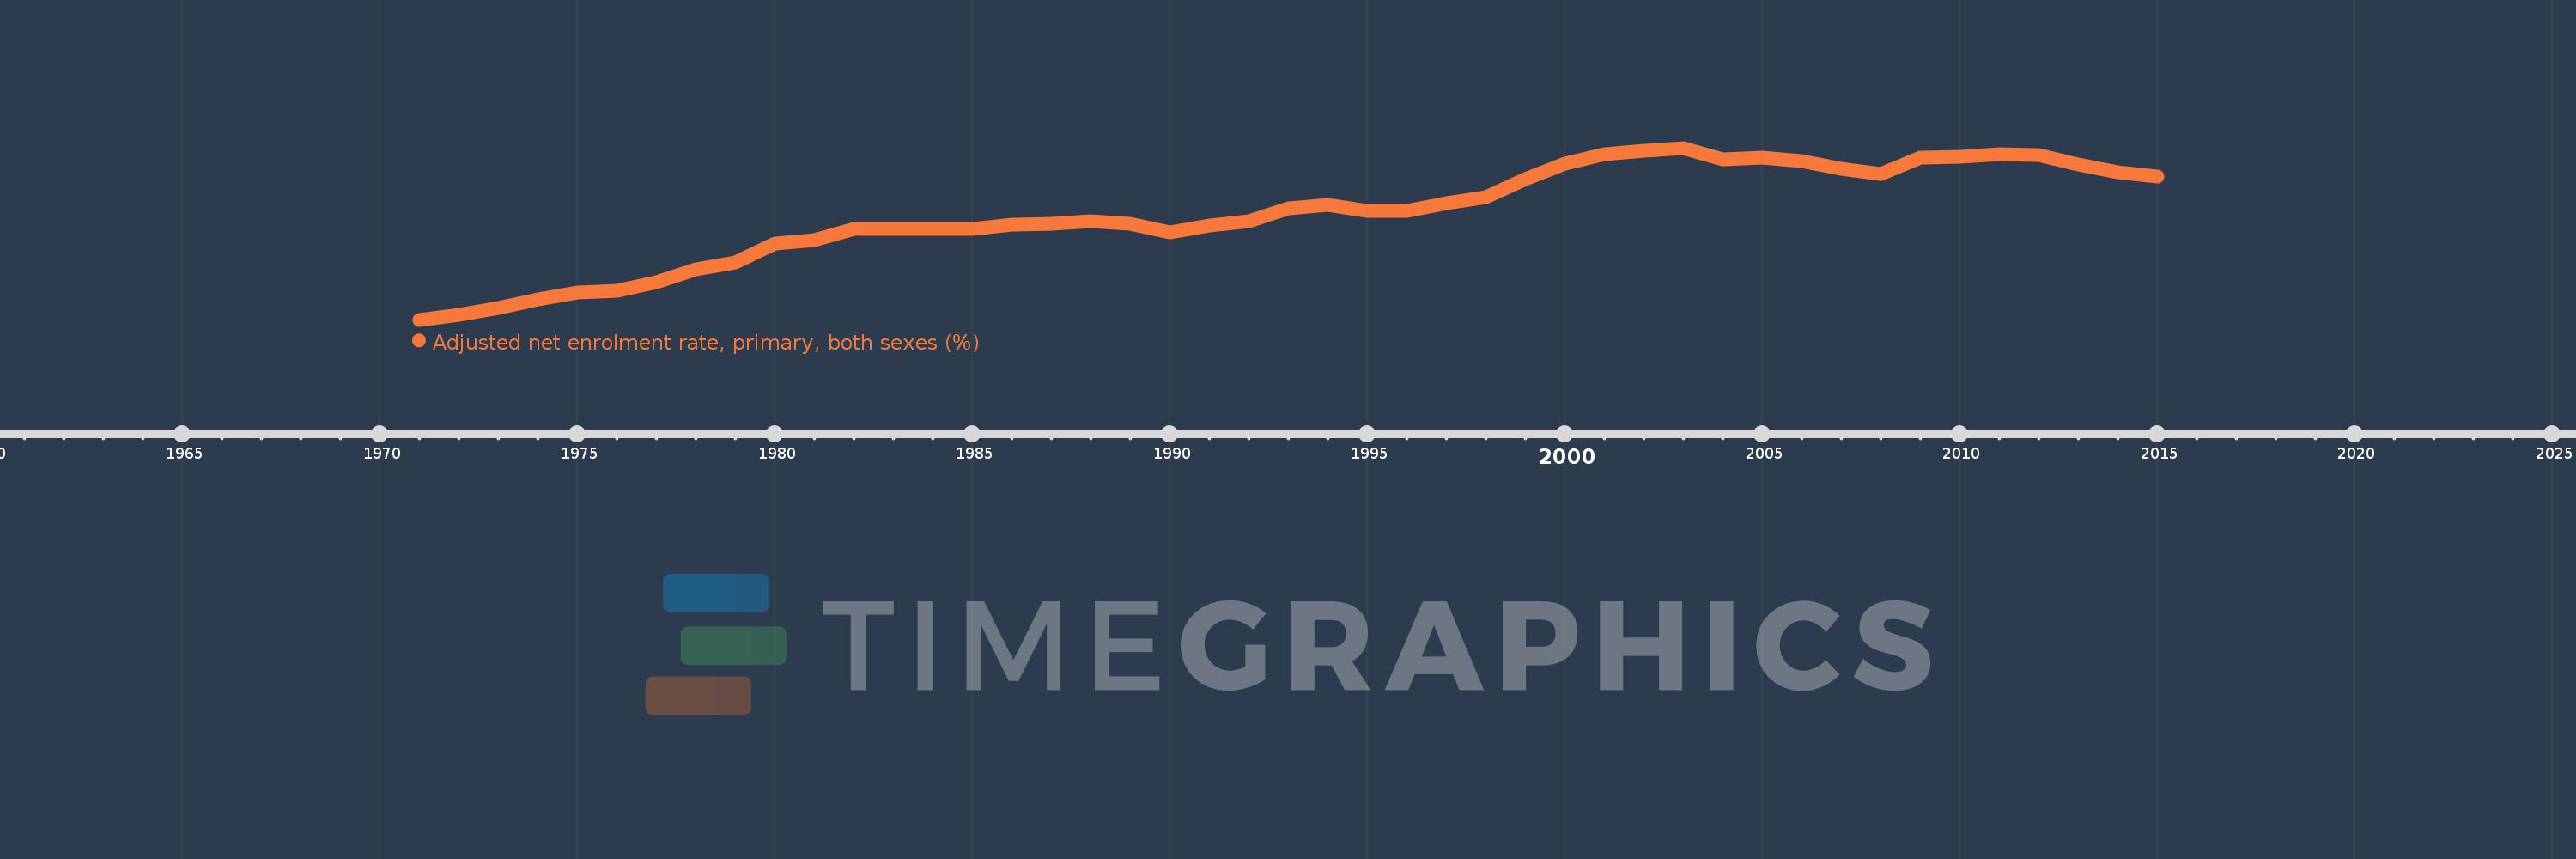
Adjusted net enrolment rate, primary, both sexes (%)
2015,2014,2013,2012,2011,2010,2009,2008,2007,2006,2005,2004,2003,2002,2001,2000,1999,1998,1997,1996,1995,1994,1993,1992,1991,1990,1989,1988,1987,1986,1985,1984,1983,1982,1981,1980,1979,1978,1977,1976,1975,1974,1973,1972,1971
This statistics in other country:
AfghanistanAlbaniaAlgeriaAngolaAntigua and BarbudaArab WorldArgentinaArmeniaArubaAustraliaAustriaAzerbaijanBahamas, TheBahrainBangladeshBarbadosBelarusBelgiumBelizeBeninBermudaBhutanBoliviaBosnia and HerzegovinaBotswanaBrazilBrunei DarussalamBulgariaBurkina FasoBurundiCabo VerdeCambodiaCameroonCanadaCaribbean small statesCentral African RepublicCentral Europe and the BalticsChadChileChinaColombiaComorosCongo, Dem. Rep.Congo, Rep.Costa RicaCote d'IvoireCroatiaCubaCyprusDenmarkDjiboutiDominicaDominican RepublicEarly-demographic dividendEast Asia & PacificEast Asia & Pacific (excluding high income)East Asia & Pacific (IDA & IBRD countries)EcuadorEgypt, Arab Rep.El SalvadorEquatorial GuineaEritreaEstoniaEthiopiaEuro areaEurope & Central AsiaEurope & Central Asia (excluding high income)Europe & Central Asia (IDA & IBRD countries)European UnionFijiFinlandFragile and conflict affected situationsFranceGabonGambia, TheGeorgiaGermanyGhanaGreeceGrenadaGuatemalaGuineaGuinea-BissauGuyanaHaitiHeavily indebted poor countries (HIPC)High incomeHondurasHong Kong SAR, ChinaHungaryIBRD onlyIcelandIDA & IBRD totalIDA blendIDA onlyIDA totalIndiaIndonesiaIran, Islamic Rep.IraqIrelandIsraelItalyJamaicaJapanJordanKazakhstanKenyaKiribatiKorea, Dem. People’s Rep.Korea, Rep.KuwaitKyrgyz RepublicLao PDRLate-demographic dividendLatin America & Caribbean Latin America & Caribbean (excluding high income)Latin America & the Caribbean (IDA & IBRD countries)LatviaLeast developed countries: UN classificationLebanonLesothoLiberiaLibyaLiechtensteinLithuaniaLow & middle incomeLow incomeLower middle incomeLuxembourgMacao SAR, ChinaMacedonia, FYRMadagascarMalawiMalaysiaMaldivesMaliMaltaMarshall IslandsMauritaniaMauritiusMexicoMicronesia, Fed. Sts.Middle East & North AfricaMiddle East & North Africa (excluding high income)Middle East & North Africa (IDA & IBRD countries)Middle incomeMoldovaMongoliaMontenegroMoroccoMozambiqueMyanmarNamibiaNauruNepalNetherlandsNew ZealandNicaraguaNigerNigeriaNorth AmericaNorwayOECD membersOmanOther small statesPacific island small statesPakistanPalauPanamaPapua New GuineaParaguayPeruPhilippinesPolandPortugalPost-demographic dividendPre-demographic dividendPuerto RicoQatarRomaniaRussian FederationRwandaSamoaSan MarinoSao Tome and PrincipeSaudi ArabiaSenegalSerbiaSeychellesSierra LeoneSloveniaSmall statesSolomon IslandsSomaliaSouth AfricaSouth AsiaSouth Asia (IDA & IBRD)South SudanSpainSri LankaSt. Kitts and NevisSt. LuciaSt. Vincent and the GrenadinesSub-Saharan Africa Sub-Saharan Africa (excluding high income)Sub-Saharan Africa (IDA & IBRD countries)SudanSurinameSwazilandSwedenSwitzerlandSyrian Arab RepublicTajikistanTanzaniaThailandTimor-LesteTogoTongaTrinidad and TobagoTunisiaTurkeyTuvaluUgandaUkraineUnited Arab EmiratesUnited KingdomUnited StatesUpper middle incomeUruguayUzbekistanVanuatuVenezuela, RBVietnamWest Bank and GazaWorldYemen, Rep.ZambiaZimbabwe Timeline:
This timeline shows a graph from 1971 to 2015 of Latin America & Caribbean . No data until 1970. Number of actual observations by date: 45.
Source name:
World Development Indicators
Source organization:
UNESCO Institute for Statistics
Categories, topics:
Education
Last updated:
apr 23, 2017
Indicators value changes by year
Minimum:
83.273
jan 1, 1971
Maximum:
96.116
jan 1, 2003
At the date of observation
Value
Absolute change
Change from previous value
jan 1, 1971
83.273
+83.273
0.0%
jan 1, 1972
83.67
+0.398
0.48%
jan 1, 1973
84.131
+0.461
0.55%
jan 1, 1974
84.774
+0.644
0.76%
jan 1, 1975
85.32
+0.545
0.64%
jan 1, 1976
85.438
+0.119
0.14%
jan 1, 1977
86.07
+0.632
0.74%
jan 1, 1978
87.034
+0.964
1.12%
jan 1, 1979
87.555
+0.521
0.6%
jan 1, 1980
88.993
+1.438
1.64%
jan 1, 1981
89.229
+0.237
0.27%
jan 1, 1982
90.091
+0.861
0.97%
jan 1, 1983
90.058
-0.032
-0.04%
jan 1, 1984
90.075
+0.016
0.02%
jan 1, 1985
90.067
-0.008
-0.01%
jan 1, 1986
90.397
+0.33
0.37%
jan 1, 1987
90.452
+0.055
0.06%
jan 1, 1988
90.624
+0.172
0.19%
jan 1, 1989
90.436
-0.187
-0.21%
jan 1, 1990
89.782
-0.654
-0.72%
jan 1, 1991
90.311
+0.529
0.59%
jan 1, 1992
90.657
+0.346
0.38%
jan 1, 1993
91.572
+0.914
1.01%
jan 1, 1994
91.856
+0.284
0.31%
jan 1, 1995
91.439
-0.417
-0.45%
jan 1, 1996
91.437
-0.002
0.0%
jan 1, 1997
91.965
+0.529
0.58%
jan 1, 1998
92.447
+0.482
0.52%
jan 1, 1999
93.79
+1.343
1.45%
jan 1, 2000
94.925
+1.135
1.21%
jan 1, 2001
95.66
+0.735
0.77%
jan 1, 2002
95.911
+0.251
0.26%
jan 1, 2003
96.116
+0.205
0.21%
jan 1, 2004
95.288
-0.829
-0.86%
jan 1, 2005
95.411
+0.123
0.13%
jan 1, 2006
95.159
-0.252
-0.26%
jan 1, 2007
94.574
-0.585
-0.61%
jan 1, 2008
94.154
-0.42
-0.44%
jan 1, 2009
95.387
+1.234
1.31%
jan 1, 2010
95.463
+0.076
0.08%
jan 1, 2011
95.63
+0.167
0.17%
jan 1, 2012
95.575
-0.055
-0.06%
jan 1, 2013
94.849
-0.726
-0.76%
jan 1, 2014
94.302
-0.547
-0.58%
jan 1, 2015
93.975
-0.327
-0.35%
Ranking of countries by current statistics by years


Comments: