29
/
en
AIzaSyAYiBZKx7MnpbEhh9jyipgxe19OcubqV5w
April 1, 2024
50600
Middle income
MIC
false
2
1
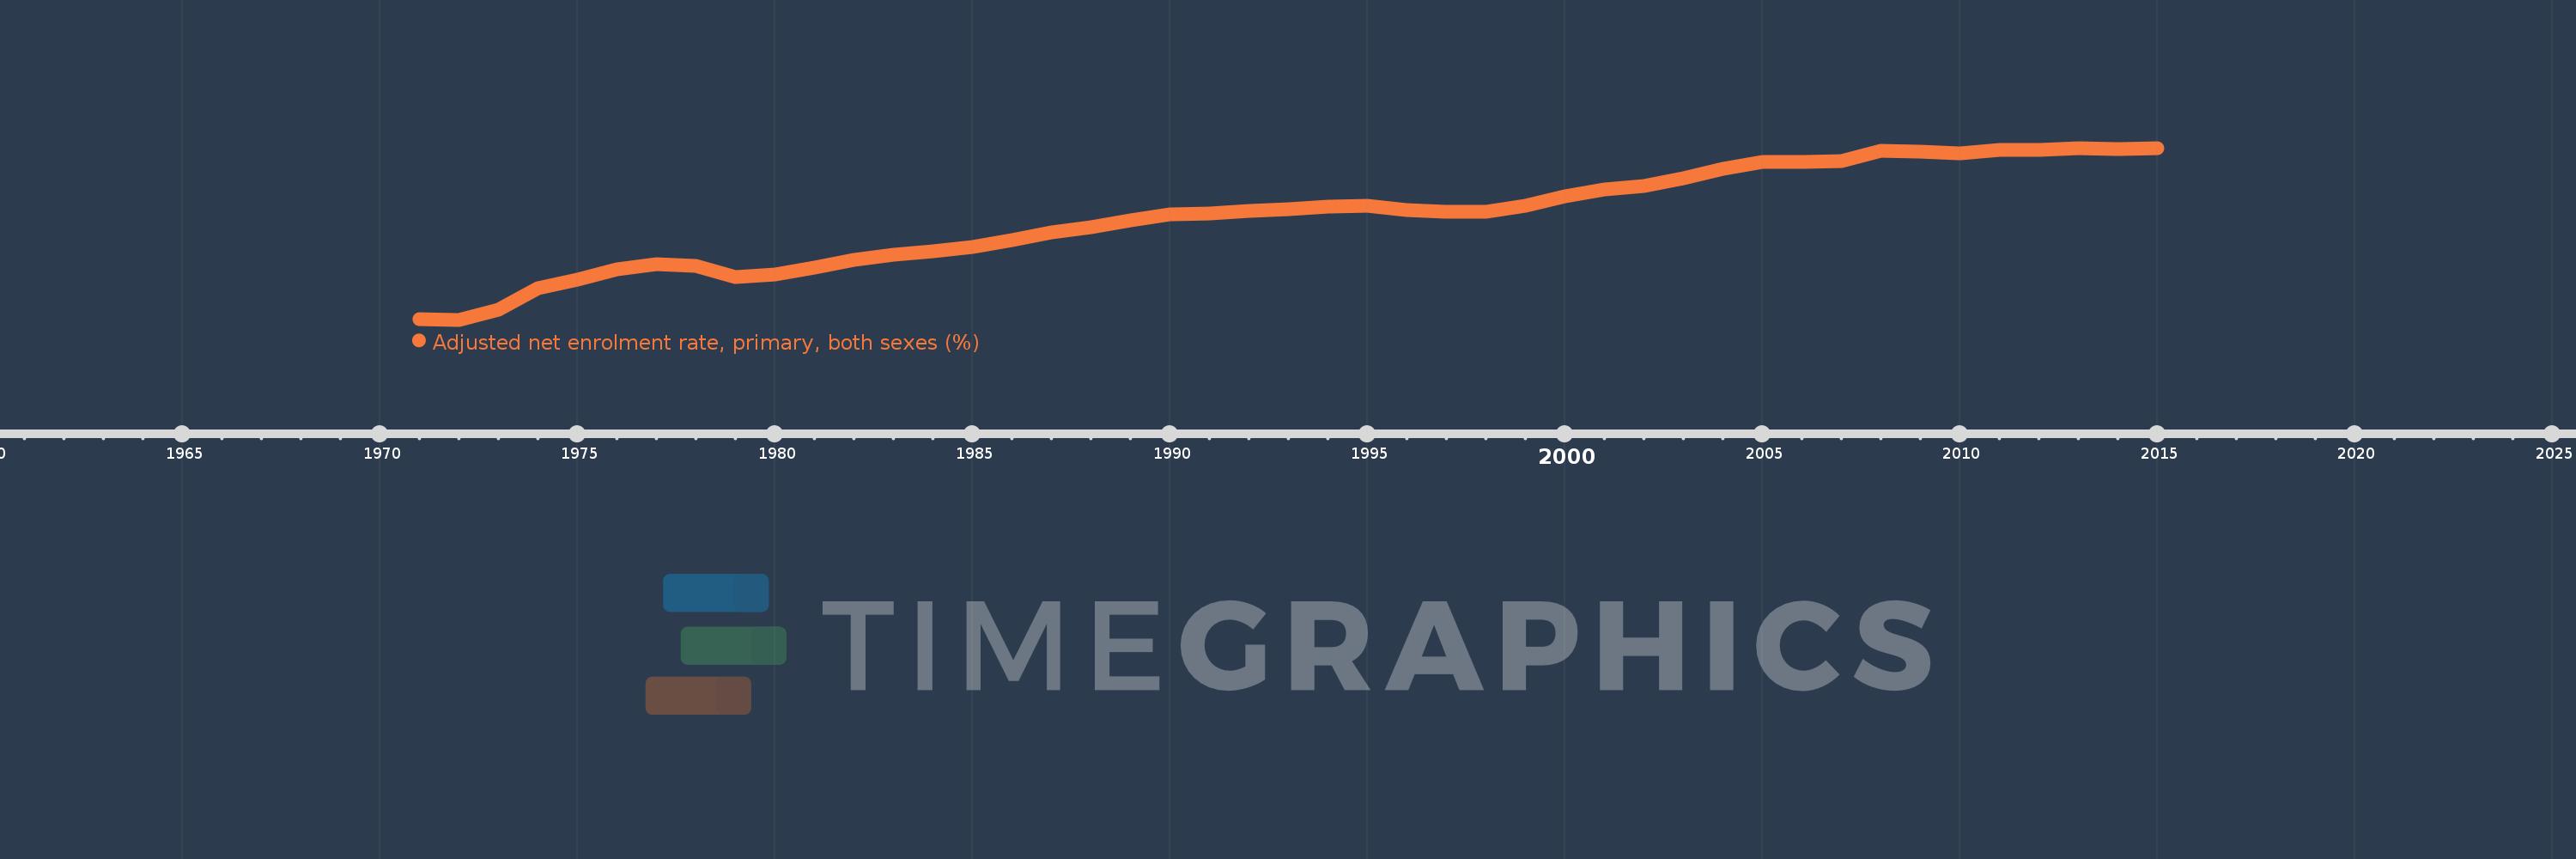
Adjusted net enrolment rate, primary, both sexes (%)
2015,2014,2013,2012,2011,2010,2009,2008,2007,2006,2005,2004,2003,2002,2001,2000,1999,1998,1997,1996,1995,1994,1993,1992,1991,1990,1989,1988,1987,1986,1985,1984,1983,1982,1981,1980,1979,1978,1977,1976,1975,1974,1973,1972,1971
This statistics in other country:
AfghanistanAlbaniaAlgeriaAngolaAntigua and BarbudaArab WorldArgentinaArmeniaArubaAustraliaAustriaAzerbaijanBahamas, TheBahrainBangladeshBarbadosBelarusBelgiumBelizeBeninBermudaBhutanBoliviaBosnia and HerzegovinaBotswanaBrazilBrunei DarussalamBulgariaBurkina FasoBurundiCabo VerdeCambodiaCameroonCanadaCaribbean small statesCentral African RepublicCentral Europe and the BalticsChadChileChinaColombiaComorosCongo, Dem. Rep.Congo, Rep.Costa RicaCote d'IvoireCroatiaCubaCyprusDenmarkDjiboutiDominicaDominican RepublicEarly-demographic dividendEast Asia & PacificEast Asia & Pacific (excluding high income)East Asia & Pacific (IDA & IBRD countries)EcuadorEgypt, Arab Rep.El SalvadorEquatorial GuineaEritreaEstoniaEthiopiaEuro areaEurope & Central AsiaEurope & Central Asia (excluding high income)Europe & Central Asia (IDA & IBRD countries)European UnionFijiFinlandFragile and conflict affected situationsFranceGabonGambia, TheGeorgiaGermanyGhanaGreeceGrenadaGuatemalaGuineaGuinea-BissauGuyanaHaitiHeavily indebted poor countries (HIPC)High incomeHondurasHong Kong SAR, ChinaHungaryIBRD onlyIcelandIDA & IBRD totalIDA blendIDA onlyIDA totalIndiaIndonesiaIran, Islamic Rep.IraqIrelandIsraelItalyJamaicaJapanJordanKazakhstanKenyaKiribatiKorea, Dem. People’s Rep.Korea, Rep.KuwaitKyrgyz RepublicLao PDRLate-demographic dividendLatin America & Caribbean Latin America & Caribbean (excluding high income)Latin America & the Caribbean (IDA & IBRD countries)LatviaLeast developed countries: UN classificationLebanonLesothoLiberiaLibyaLiechtensteinLithuaniaLow & middle incomeLow incomeLower middle incomeLuxembourgMacao SAR, ChinaMacedonia, FYRMadagascarMalawiMalaysiaMaldivesMaliMaltaMarshall IslandsMauritaniaMauritiusMexicoMicronesia, Fed. Sts.Middle East & North AfricaMiddle East & North Africa (excluding high income)Middle East & North Africa (IDA & IBRD countries)Middle incomeMoldovaMongoliaMontenegroMoroccoMozambiqueMyanmarNamibiaNauruNepalNetherlandsNew ZealandNicaraguaNigerNigeriaNorth AmericaNorwayOECD membersOmanOther small statesPacific island small statesPakistanPalauPanamaPapua New GuineaParaguayPeruPhilippinesPolandPortugalPost-demographic dividendPre-demographic dividendPuerto RicoQatarRomaniaRussian FederationRwandaSamoaSan MarinoSao Tome and PrincipeSaudi ArabiaSenegalSerbiaSeychellesSierra LeoneSloveniaSmall statesSolomon IslandsSomaliaSouth AfricaSouth AsiaSouth Asia (IDA & IBRD)South SudanSpainSri LankaSt. Kitts and NevisSt. LuciaSt. Vincent and the GrenadinesSub-Saharan Africa Sub-Saharan Africa (excluding high income)Sub-Saharan Africa (IDA & IBRD countries)SudanSurinameSwazilandSwedenSwitzerlandSyrian Arab RepublicTajikistanTanzaniaThailandTimor-LesteTogoTongaTrinidad and TobagoTunisiaTurkeyTuvaluUgandaUkraineUnited Arab EmiratesUnited KingdomUnited StatesUpper middle incomeUruguayUzbekistanVanuatuVenezuela, RBVietnamWest Bank and GazaWorldYemen, Rep.ZambiaZimbabwe Timeline:
This timeline shows a graph from 1971 to 2015 of Middle income. No data until 1970. Number of actual observations by date: 45.
Source name:
World Development Indicators
Source organization:
UNESCO Institute for Statistics
Categories, topics:
Education
Last updated:
apr 23, 2017
Indicators value changes by year
Minimum:
71.035
jan 1, 1972
Maximum:
92.379
jan 1, 2013
At the date of observation
Value
Absolute change
Change from previous value
jan 1, 1971
71.086
+71.086
0.0%
jan 1, 1972
71.035
-0.051
-0.07%
jan 1, 1973
72.231
+1.196
1.68%
jan 1, 1974
74.991
+2.761
3.82%
jan 1, 1975
75.983
+0.992
1.32%
jan 1, 1976
77.328
+1.344
1.77%
jan 1, 1977
77.92
+0.592
0.77%
jan 1, 1978
77.765
-0.155
-0.2%
jan 1, 1979
76.29
-1.474
-1.9%
jan 1, 1980
76.671
+0.38
0.5%
jan 1, 1981
77.538
+0.867
1.13%
jan 1, 1982
78.474
+0.936
1.21%
jan 1, 1983
79.099
+0.625
0.8%
jan 1, 1984
79.525
+0.426
0.54%
jan 1, 1985
80.043
+0.519
0.65%
jan 1, 1986
80.956
+0.912
1.14%
jan 1, 1987
81.939
+0.983
1.21%
jan 1, 1988
82.502
+0.563
0.69%
jan 1, 1989
83.37
+0.868
1.05%
jan 1, 1990
84.089
+0.719
0.86%
jan 1, 1991
84.229
+0.14
0.17%
jan 1, 1992
84.579
+0.35
0.41%
jan 1, 1993
84.808
+0.229
0.27%
jan 1, 1994
85.114
+0.306
0.36%
jan 1, 1995
85.236
+0.122
0.14%
jan 1, 1996
84.648
-0.588
-0.69%
jan 1, 1997
84.432
-0.216
-0.25%
jan 1, 1998
84.476
+0.044
0.05%
jan 1, 1999
85.226
+0.75
0.89%
jan 1, 2000
86.32
+1.094
1.28%
jan 1, 2001
87.264
+0.944
1.09%
jan 1, 2002
87.682
+0.418
0.48%
jan 1, 2003
88.64
+0.958
1.09%
jan 1, 2004
89.829
+1.189
1.34%
jan 1, 2005
90.666
+0.838
0.93%
jan 1, 2006
90.657
-0.01
-0.01%
jan 1, 2007
90.791
+0.135
0.15%
jan 1, 2008
92.044
+1.253
1.38%
jan 1, 2009
91.879
-0.165
-0.18%
jan 1, 2010
91.731
-0.148
-0.16%
jan 1, 2011
92.114
+0.383
0.42%
jan 1, 2012
92.126
+0.012
0.01%
jan 1, 2013
92.379
+0.253
0.27%
jan 1, 2014
92.293
-0.086
-0.09%
jan 1, 2015
92.336
+0.043
0.05%
Ranking of countries by current statistics by years


Comments: