29
/
en
AIzaSyAYiBZKx7MnpbEhh9jyipgxe19OcubqV5w
April 1, 2024
256987
Switzerland
CHE
true
2
1
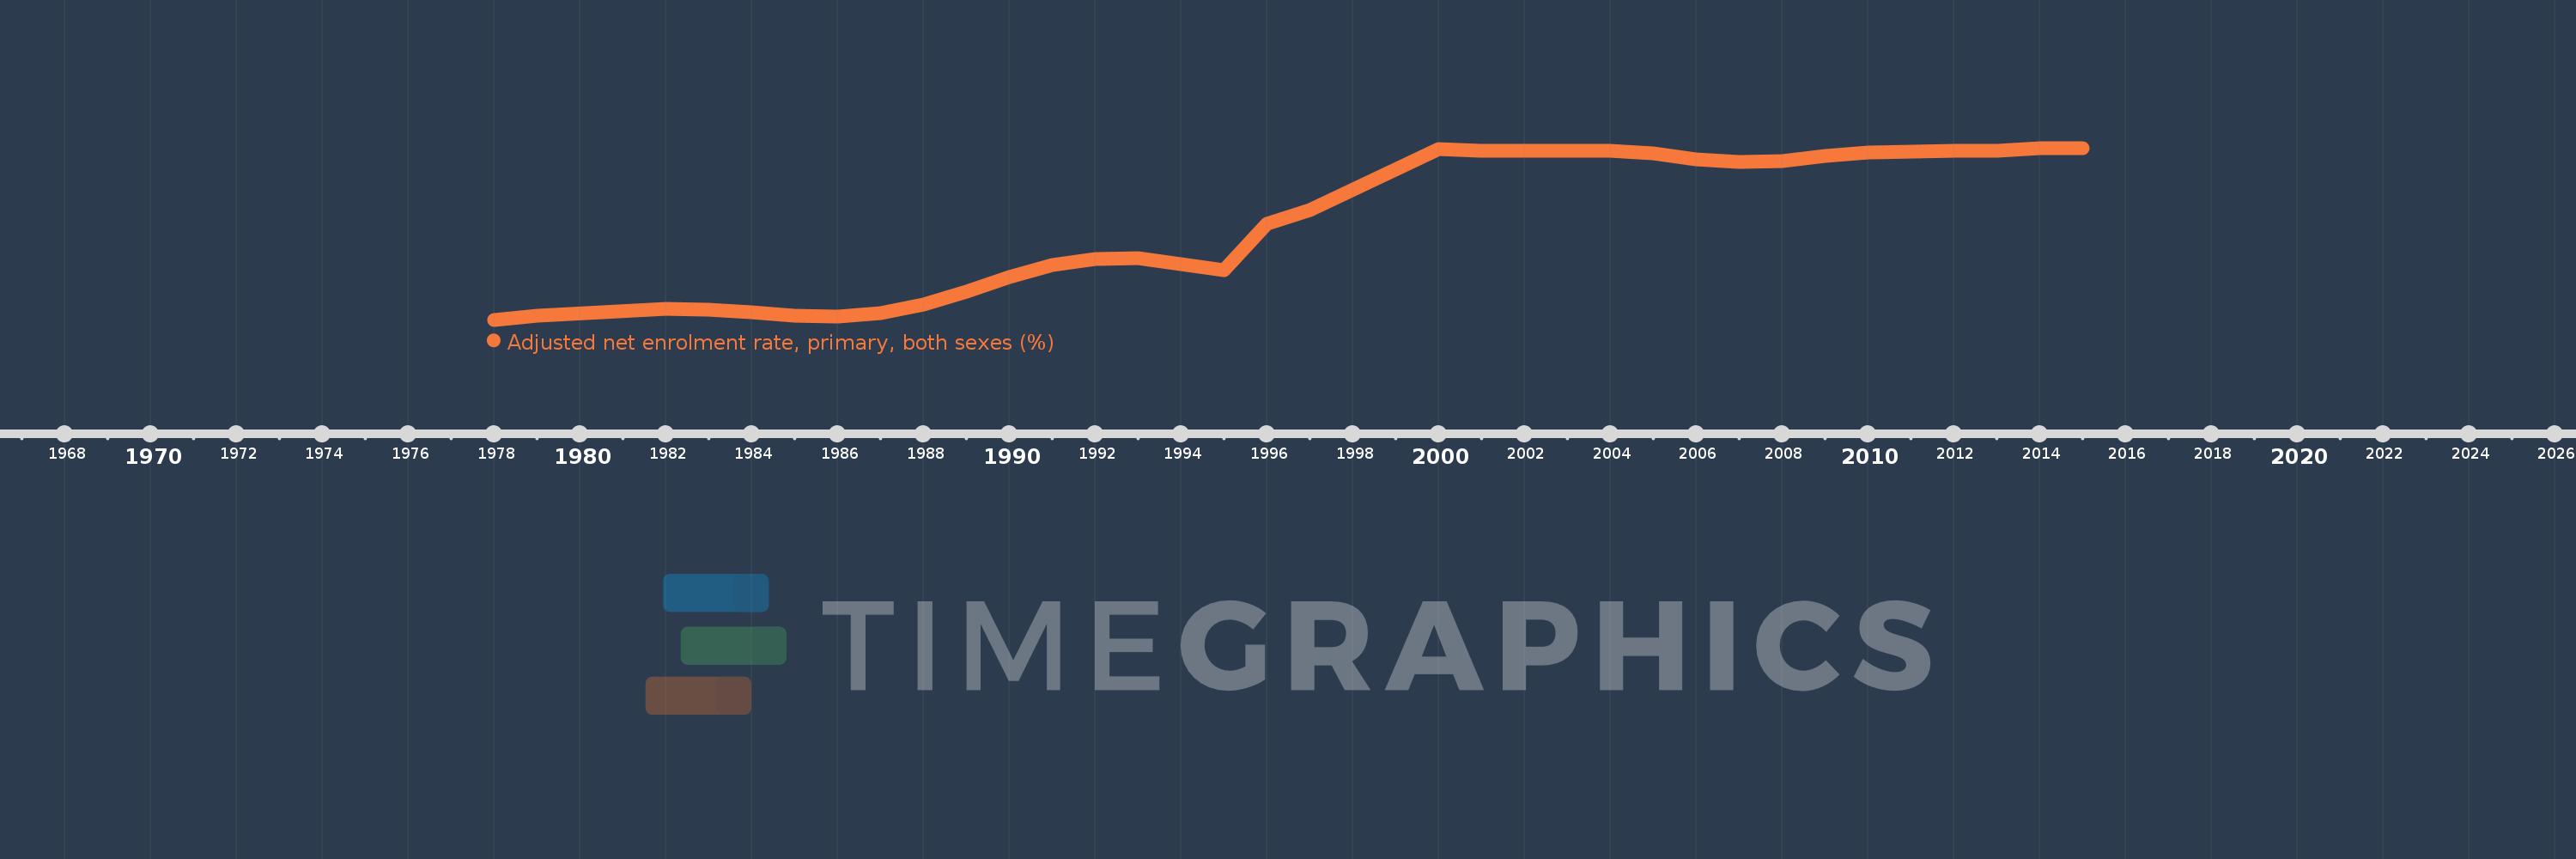
Adjusted net enrolment rate, primary, both sexes (%)
2015,2014,2013,2012,2011,2010,2009,2008,2007,2006,2005,2004,2003,2002,2001,2000,1997,1996,1995,1994,1993,1992,1991,1990,1989,1988,1987,1986,1985,1984,1983,1982,1979,1978
This statistics in other country:
AfghanistanAlbaniaAlgeriaAngolaAntigua and BarbudaArab WorldArgentinaArmeniaArubaAustraliaAustriaAzerbaijanBahamas, TheBahrainBangladeshBarbadosBelarusBelgiumBelizeBeninBermudaBhutanBoliviaBosnia and HerzegovinaBotswanaBrazilBrunei DarussalamBulgariaBurkina FasoBurundiCabo VerdeCambodiaCameroonCanadaCaribbean small statesCentral African RepublicCentral Europe and the BalticsChadChileChinaColombiaComorosCongo, Dem. Rep.Congo, Rep.Costa RicaCote d'IvoireCroatiaCubaCyprusDenmarkDjiboutiDominicaDominican RepublicEarly-demographic dividendEast Asia & PacificEast Asia & Pacific (excluding high income)East Asia & Pacific (IDA & IBRD countries)EcuadorEgypt, Arab Rep.El SalvadorEquatorial GuineaEritreaEstoniaEthiopiaEuro areaEurope & Central AsiaEurope & Central Asia (excluding high income)Europe & Central Asia (IDA & IBRD countries)European UnionFijiFinlandFragile and conflict affected situationsFranceGabonGambia, TheGeorgiaGermanyGhanaGreeceGrenadaGuatemalaGuineaGuinea-BissauGuyanaHaitiHeavily indebted poor countries (HIPC)High incomeHondurasHong Kong SAR, ChinaHungaryIBRD onlyIcelandIDA & IBRD totalIDA blendIDA onlyIDA totalIndiaIndonesiaIran, Islamic Rep.IraqIrelandIsraelItalyJamaicaJapanJordanKazakhstanKenyaKiribatiKorea, Dem. People’s Rep.Korea, Rep.KuwaitKyrgyz RepublicLao PDRLate-demographic dividendLatin America & Caribbean Latin America & Caribbean (excluding high income)Latin America & the Caribbean (IDA & IBRD countries)LatviaLeast developed countries: UN classificationLebanonLesothoLiberiaLibyaLiechtensteinLithuaniaLow & middle incomeLow incomeLower middle incomeLuxembourgMacao SAR, ChinaMacedonia, FYRMadagascarMalawiMalaysiaMaldivesMaliMaltaMarshall IslandsMauritaniaMauritiusMexicoMicronesia, Fed. Sts.Middle East & North AfricaMiddle East & North Africa (excluding high income)Middle East & North Africa (IDA & IBRD countries)Middle incomeMoldovaMongoliaMontenegroMoroccoMozambiqueMyanmarNamibiaNauruNepalNetherlandsNew ZealandNicaraguaNigerNigeriaNorth AmericaNorwayOECD membersOmanOther small statesPacific island small statesPakistanPalauPanamaPapua New GuineaParaguayPeruPhilippinesPolandPortugalPost-demographic dividendPre-demographic dividendPuerto RicoQatarRomaniaRussian FederationRwandaSamoaSan MarinoSao Tome and PrincipeSaudi ArabiaSenegalSerbiaSeychellesSierra LeoneSloveniaSmall statesSolomon IslandsSomaliaSouth AfricaSouth AsiaSouth Asia (IDA & IBRD)South SudanSpainSri LankaSt. Kitts and NevisSt. LuciaSt. Vincent and the GrenadinesSub-Saharan Africa Sub-Saharan Africa (excluding high income)Sub-Saharan Africa (IDA & IBRD countries)SudanSurinameSwazilandSwedenSwitzerlandSyrian Arab RepublicTajikistanTanzaniaThailandTimor-LesteTogoTongaTrinidad and TobagoTunisiaTurkeyTuvaluUgandaUkraineUnited Arab EmiratesUnited KingdomUnited StatesUpper middle incomeUruguayUzbekistanVanuatuVenezuela, RBVietnamWest Bank and GazaWorldYemen, Rep.ZambiaZimbabwe Timeline:
This timeline shows a graph from 1978 to 2015 of Switzerland. No data until 1977. Number of actual observations by date: 34.
Source name:
World Development Indicators
Source organization:
UNESCO Institute for Statistics
Categories, topics:
Education
Last updated:
apr 23, 2017
Indicators value changes by year
Maximum:
99.644
jan 1, 2015
At the date of observation
Value
Absolute change
Change from previous value
jan 1, 1978
75.65
+75.65
0.0%
jan 1, 1979
76.183
+0.533
0.7%
jan 1, 1982
77.139
+0.956
1.26%
jan 1, 1983
77.103
-0.037
-0.05%
jan 1, 1984
76.731
-0.372
-0.48%
jan 1, 1985
76.207
-0.524
-0.68%
jan 1, 1986
76.146
-0.06
-0.08%
jan 1, 1987
76.556
+0.409
0.54%
jan 1, 1988
77.736
+1.18
1.54%
jan 1, 1989
79.523
+1.787
2.3%
jan 1, 1990
81.589
+2.066
2.6%
jan 1, 1991
83.323
+1.734
2.12%
jan 1, 1992
84.151
+0.828
0.99%
jan 1, 1993
84.209
+0.058
0.07%
jan 1, 1994
83.427
-0.782
-0.93%
jan 1, 1995
82.552
-0.875
-1.05%
jan 1, 1996
88.991
+6.439
7.8%
jan 1, 1997
90.912
+1.921
2.16%
jan 1, 2000
99.486
+8.574
9.43%
jan 1, 2001
99.297
-0.188
-0.19%
jan 1, 2002
99.224
-0.073
-0.07%
jan 1, 2003
99.231
+0.007
0.01%
jan 1, 2004
99.235
+0.004
0.0%
jan 1, 2005
98.925
-0.31
-0.31%
jan 1, 2006
98.072
-0.852
-0.86%
jan 1, 2007
97.718
-0.354
-0.36%
jan 1, 2008
97.832
+0.114
0.12%
jan 1, 2009
98.563
+0.731
0.75%
jan 1, 2010
99.046
+0.483
0.49%
jan 1, 2011
99.11
+0.064
0.07%
jan 1, 2012
99.261
+0.151
0.15%
jan 1, 2013
99.228
-0.033
-0.03%
jan 1, 2014
99.636
+0.408
0.41%
jan 1, 2015
99.644
+0.008
0.01%
Ranking of countries by current statistics by years


Comments: