29
/
en
AIzaSyAYiBZKx7MnpbEhh9jyipgxe19OcubqV5w
April 1, 2024
68822
Antigua and Barbuda
ATG
true
2
1
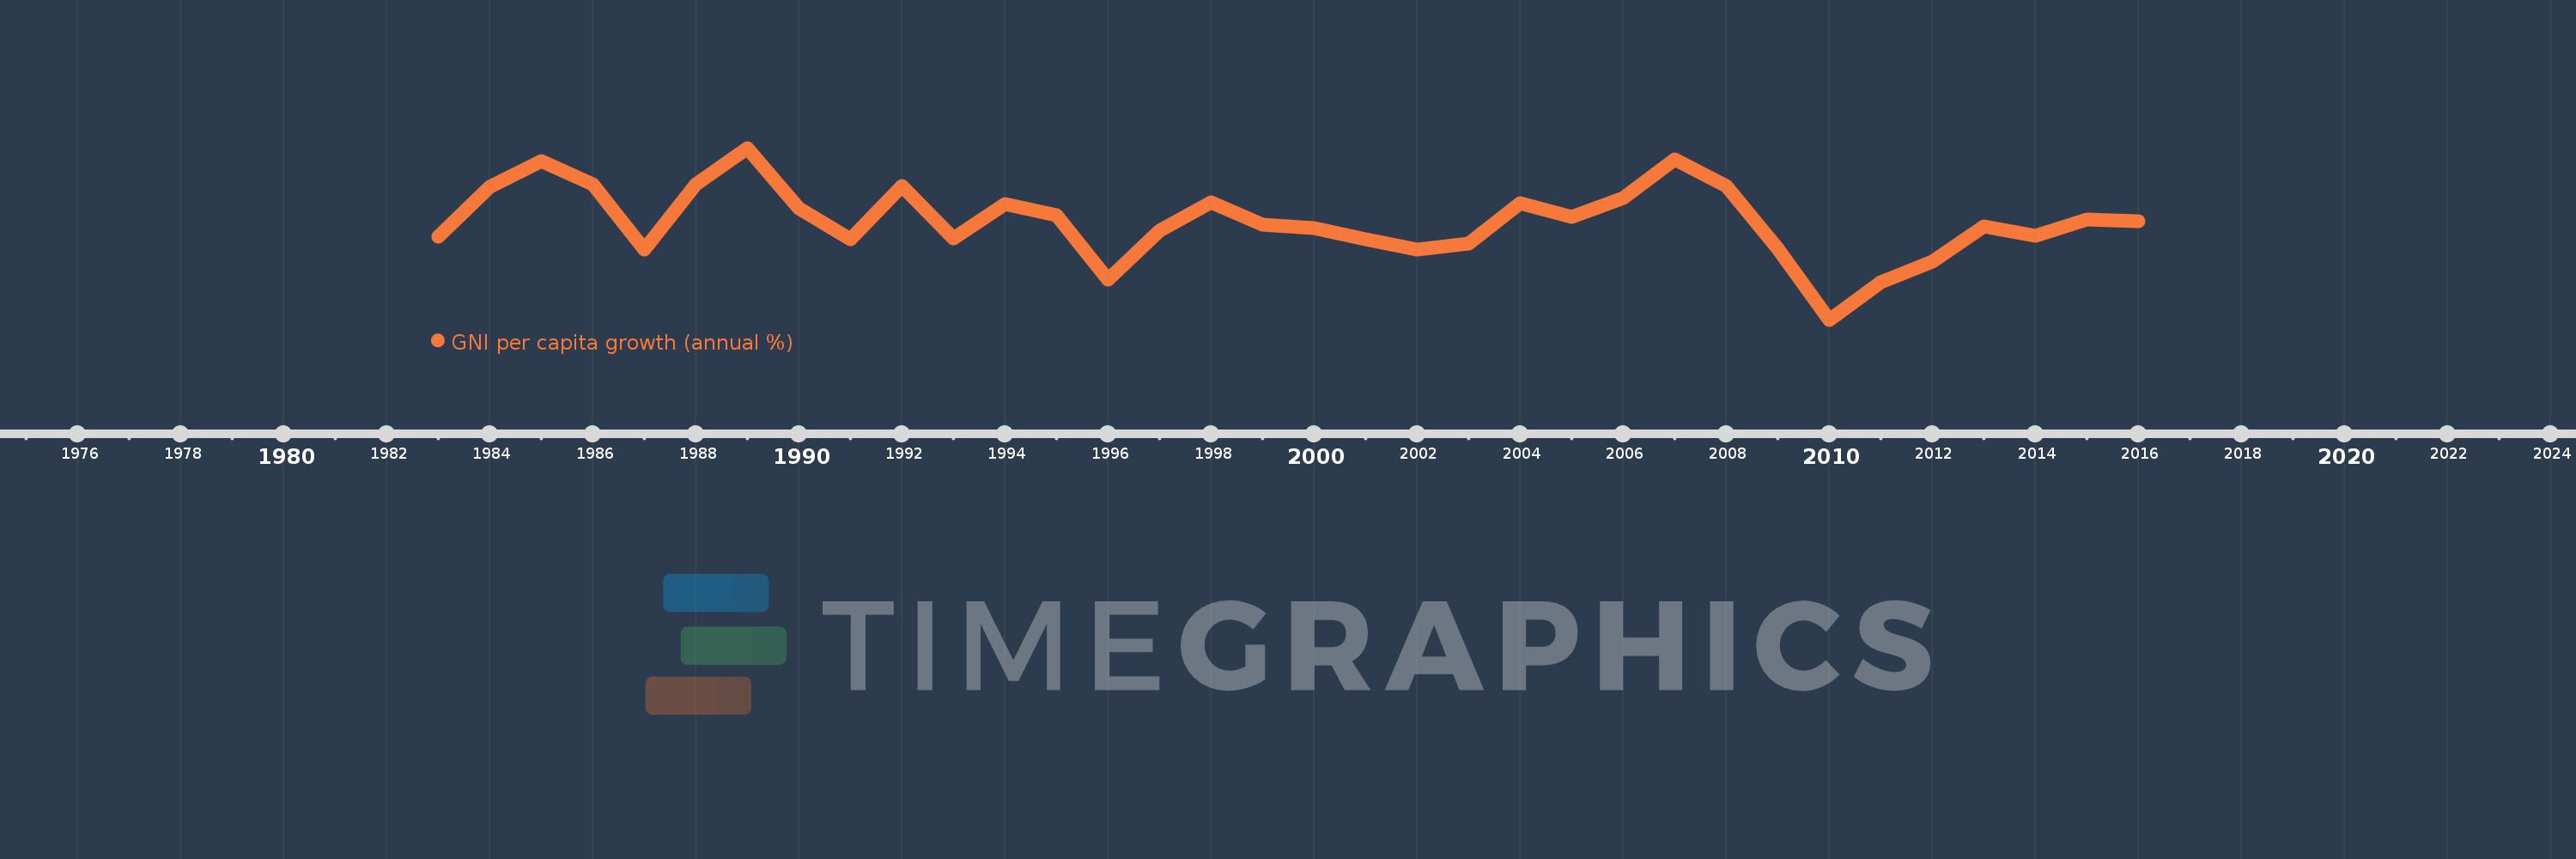
GNI per capita growth (annual %)
2016,2015,2014,2013,2012,2011,2010,2009,2008,2007,2006,2005,2004,2003,2002,2001,2000,1999,1998,1997,1996,1995,1994,1993,1992,1991,1990,1989,1988,1987,1986,1985,1984,1983
This statistics in other country:
AlbaniaAlgeriaAngolaAntigua and BarbudaArab WorldArgentinaArmeniaAustraliaAustriaAzerbaijanBahamas, TheBahrainBangladeshBarbadosBelarusBelgiumBelizeBeninBhutanBoliviaBosnia and HerzegovinaBotswanaBrazilBrunei DarussalamBulgariaBurkina FasoBurundiCabo VerdeCambodiaCameroonCanadaCaribbean small statesCentral Europe and the BalticsChadChileChinaColombiaComorosCongo, Dem. Rep.Congo, Rep.Costa RicaCote d'IvoireCroatiaCubaCyprusCzech RepublicDenmarkDjiboutiDominican RepublicEarly-demographic dividendEast Asia & PacificEast Asia & Pacific (excluding high income)East Asia & Pacific (IDA & IBRD countries)EcuadorEgypt, Arab Rep.El SalvadorEquatorial GuineaEritreaEstoniaEthiopiaEuro areaEurope & Central AsiaEurope & Central Asia (excluding high income)Europe & Central Asia (IDA & IBRD countries)European UnionFijiFinlandFranceGabonGambia, TheGeorgiaGermanyGhanaGreeceGuatemalaGuineaGuinea-BissauHaitiHeavily indebted poor countries (HIPC)High incomeHondurasHong Kong SAR, ChinaHungaryIBRD onlyIcelandIDA & IBRD totalIDA blendIDA onlyIDA totalIndiaIndonesiaIran, Islamic Rep.IrelandIsraelItalyJamaicaJapanJordanKazakhstanKenyaKorea, Rep.KosovoKuwaitKyrgyz RepublicLao PDRLate-demographic dividendLatin America & Caribbean Latin America & Caribbean (excluding high income)Latin America & the Caribbean (IDA & IBRD countries)LatviaLeast developed countries: UN classificationLebanonLiberiaLibyaLithuaniaLow & middle incomeLow incomeLower middle incomeLuxembourgMacao SAR, ChinaMacedonia, FYRMadagascarMalawiMalaysiaMaliMaltaMauritaniaMauritiusMexicoMiddle East & North AfricaMiddle East & North Africa (excluding high income)Middle East & North Africa (IDA & IBRD countries)Middle incomeMoldovaMongoliaMontenegroMoroccoMozambiqueMyanmarNamibiaNepalNetherlandsNew ZealandNicaraguaNigerNigeriaNorth AmericaNorwayOECD membersOmanOther small statesPakistanPanamaPapua New GuineaParaguayPeruPhilippinesPolandPortugalPost-demographic dividendPre-demographic dividendPuerto RicoQatarRomaniaRussian FederationRwandaSamoaSaudi ArabiaSenegalSerbiaSeychellesSierra LeoneSingaporeSlovak RepublicSloveniaSmall statesSomaliaSouth AfricaSouth AsiaSouth Asia (IDA & IBRD)South SudanSpainSri LankaSub-Saharan Africa Sub-Saharan Africa (excluding high income)Sub-Saharan Africa (IDA & IBRD countries)SudanSurinameSwazilandSwedenSwitzerlandSyrian Arab RepublicTajikistanTanzaniaThailandTimor-LesteTogoTrinidad and TobagoTunisiaTurkeyTurkmenistanUgandaUkraineUnited Arab EmiratesUnited KingdomUnited StatesUpper middle incomeUruguayUzbekistanVanuatuVenezuela, RBVietnamWest Bank and GazaWorldZambiaZimbabwe Timeline:
This timeline shows a graph from 1983 to 2016 of Antigua and Barbuda. No data until 1982. Number of actual observations by date: 34.
Source name:
World Development Indicators
Source organization:
World Bank national accounts data, and OECD National Accounts data files.
Categories, topics:
Economy & Growth
Last updated:
apr 23, 2017
Indicators value changes by year
Minimum:
-12.721
jan 1, 2010
Maximum:
14.309
jan 1, 1989
At the date of observation
Value
Absolute change
Change from previous value
jan 1, 1983
0.394
+0.394
0.0%
jan 1, 1984
8.145
+7.751
1.97K%
jan 1, 1985
12.221
+4.076
50.04%
jan 1, 1986
8.584
-3.636
-29.76%
jan 1, 1987
-1.655
-10.239
-119.27%
jan 1, 1988
8.647
+10.301
-622.61%
jan 1, 1989
14.309
+5.662
65.48%
jan 1, 1990
4.858
-9.451
-66.05%
jan 1, 1991
-0.09
-4.948
-101.86%
jan 1, 1992
8.324
+8.415
-9.31K%
jan 1, 1993
0.076
-8.248
-99.08%
jan 1, 1994
5.548
+5.471
7.16K%
jan 1, 1995
3.786
-1.761
-31.75%
jan 1, 1996
-6.465
-10.251
-270.74%
jan 1, 1997
1.329
+7.794
-120.56%
jan 1, 1998
5.693
+4.364
328.26%
jan 1, 1999
2.26
-3.434
-60.31%
jan 1, 2000
1.633
-0.627
-27.75%
jan 1, 2001
-0.057
-1.69
-103.5%
jan 1, 2002
-1.745
-1.688
2.95K%
jan 1, 2003
-0.705
+1.041
-59.62%
jan 1, 2004
5.639
+6.343
-899.95%
jan 1, 2005
3.453
-2.186
-38.76%
jan 1, 2006
6.427
+2.974
86.12%
jan 1, 2007
12.445
+6.018
93.65%
jan 1, 2008
8.351
-4.094
-32.9%
jan 1, 2009
-1.522
-9.873
-118.22%
jan 1, 2010
-12.721
-11.199
735.93%
jan 1, 2011
-6.75
+5.971
-46.94%
jan 1, 2012
-3.537
+3.213
-47.6%
jan 1, 2013
1.975
+5.512
-155.83%
jan 1, 2014
0.495
-1.48
-74.92%
jan 1, 2015
3.05
+2.555
515.92%
jan 1, 2016
2.743
-0.308
-10.09%
Ranking of countries by current statistics by years


Comments: