29
/
en
AIzaSyAYiBZKx7MnpbEhh9jyipgxe19OcubqV5w
April 1, 2024
49017
Middle East & North Africa (excluding high income)
MNA
false
2
1
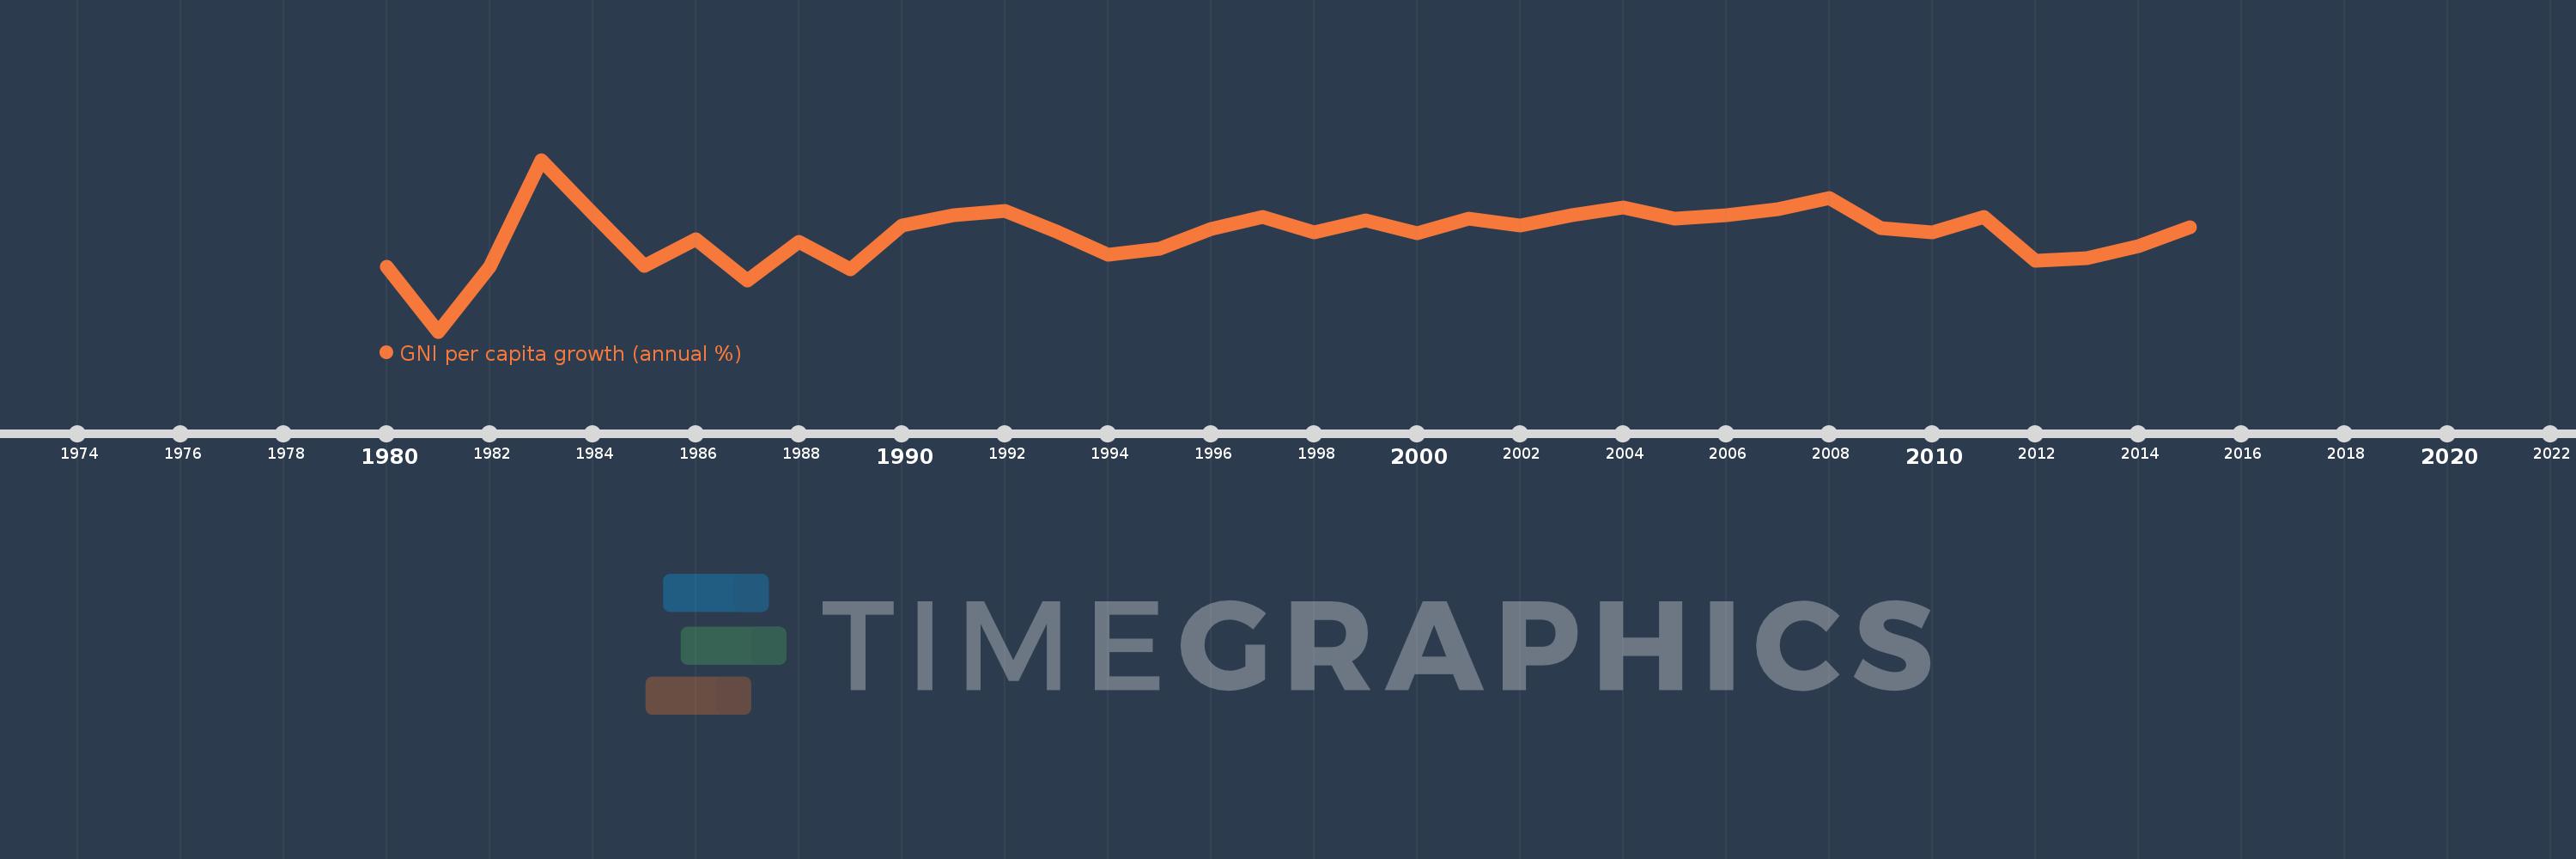
GNI per capita growth (annual %)
2015,2014,2013,2012,2011,2010,2009,2008,2007,2006,2005,2004,2003,2002,2001,2000,1999,1998,1997,1996,1995,1994,1993,1992,1991,1990,1989,1988,1987,1986,1985,1984,1983,1982,1981,1980
This statistics in other country:
AlbaniaAlgeriaAngolaAntigua and BarbudaArab WorldArgentinaArmeniaAustraliaAustriaAzerbaijanBahamas, TheBahrainBangladeshBarbadosBelarusBelgiumBelizeBeninBhutanBoliviaBosnia and HerzegovinaBotswanaBrazilBrunei DarussalamBulgariaBurkina FasoBurundiCabo VerdeCambodiaCameroonCanadaCaribbean small statesCentral Europe and the BalticsChadChileChinaColombiaComorosCongo, Dem. Rep.Congo, Rep.Costa RicaCote d'IvoireCroatiaCubaCyprusCzech RepublicDenmarkDjiboutiDominican RepublicEarly-demographic dividendEast Asia & PacificEast Asia & Pacific (excluding high income)East Asia & Pacific (IDA & IBRD countries)EcuadorEgypt, Arab Rep.El SalvadorEquatorial GuineaEritreaEstoniaEthiopiaEuro areaEurope & Central AsiaEurope & Central Asia (excluding high income)Europe & Central Asia (IDA & IBRD countries)European UnionFijiFinlandFranceGabonGambia, TheGeorgiaGermanyGhanaGreeceGuatemalaGuineaGuinea-BissauHaitiHeavily indebted poor countries (HIPC)High incomeHondurasHong Kong SAR, ChinaHungaryIBRD onlyIcelandIDA & IBRD totalIDA blendIDA onlyIDA totalIndiaIndonesiaIran, Islamic Rep.IrelandIsraelItalyJamaicaJapanJordanKazakhstanKenyaKorea, Rep.KosovoKuwaitKyrgyz RepublicLao PDRLate-demographic dividendLatin America & Caribbean Latin America & Caribbean (excluding high income)Latin America & the Caribbean (IDA & IBRD countries)LatviaLeast developed countries: UN classificationLebanonLiberiaLibyaLithuaniaLow & middle incomeLow incomeLower middle incomeLuxembourgMacao SAR, ChinaMacedonia, FYRMadagascarMalawiMalaysiaMaliMaltaMauritaniaMauritiusMexicoMiddle East & North AfricaMiddle East & North Africa (excluding high income)Middle East & North Africa (IDA & IBRD countries)Middle incomeMoldovaMongoliaMontenegroMoroccoMozambiqueMyanmarNamibiaNepalNetherlandsNew ZealandNicaraguaNigerNigeriaNorth AmericaNorwayOECD membersOmanOther small statesPakistanPanamaPapua New GuineaParaguayPeruPhilippinesPolandPortugalPost-demographic dividendPre-demographic dividendPuerto RicoQatarRomaniaRussian FederationRwandaSamoaSaudi ArabiaSenegalSerbiaSeychellesSierra LeoneSingaporeSlovak RepublicSloveniaSmall statesSomaliaSouth AfricaSouth AsiaSouth Asia (IDA & IBRD)South SudanSpainSri LankaSub-Saharan Africa Sub-Saharan Africa (excluding high income)Sub-Saharan Africa (IDA & IBRD countries)SudanSurinameSwazilandSwedenSwitzerlandSyrian Arab RepublicTajikistanTanzaniaThailandTimor-LesteTogoTrinidad and TobagoTunisiaTurkeyTurkmenistanUgandaUkraineUnited Arab EmiratesUnited KingdomUnited StatesUpper middle incomeUruguayUzbekistanVanuatuVenezuela, RBVietnamWest Bank and GazaWorldZambiaZimbabwe Timeline:
This timeline shows a graph from 1980 to 2015 of Middle East & North Africa (excluding high income). No data until 1979. Number of actual observations by date: 36.
Source name:
World Development Indicators
Source organization:
World Bank national accounts data, and OECD National Accounts data files.
Categories, topics:
Economy & Growth
Last updated:
apr 23, 2017
Indicators value changes by year
Minimum:
-13.444
jan 1, 1981
Maximum:
11.227
jan 1, 1983
At the date of observation
Value
Absolute change
Change from previous value
jan 1, 1980
-4.171
-4.171
0.0%
jan 1, 1981
-13.444
-9.273
222.35%
jan 1, 1982
-4.081
+9.363
-69.64%
jan 1, 1983
11.227
+15.308
-375.11%
jan 1, 1984
3.578
-7.65
-68.13%
jan 1, 1985
-3.997
-7.575
-211.73%
jan 1, 1986
-0.222
+3.776
-94.45%
jan 1, 1987
-6.164
-5.942
2.68K%
jan 1, 1988
-0.53
+5.633
-91.39%
jan 1, 1989
-4.461
-3.931
741.0%
jan 1, 1990
1.793
+6.254
-140.18%
jan 1, 1991
3.285
+1.492
83.23%
jan 1, 1992
3.933
+0.648
19.73%
jan 1, 1993
0.978
-2.955
-75.13%
jan 1, 1994
-2.421
-3.399
-347.54%
jan 1, 1995
-1.491
+0.93
-38.42%
jan 1, 1996
1.279
+2.77
-185.77%
jan 1, 1997
2.996
+1.717
134.31%
jan 1, 1998
0.798
-2.198
-73.35%
jan 1, 1999
2.469
+1.671
209.27%
jan 1, 2000
0.641
-1.828
-74.02%
jan 1, 2001
2.824
+2.183
340.35%
jan 1, 2002
1.736
-1.089
-38.55%
jan 1, 2003
3.253
+1.517
87.42%
jan 1, 2004
4.346
+1.093
33.6%
jan 1, 2005
2.835
-1.511
-34.76%
jan 1, 2006
3.209
+0.374
13.18%
jan 1, 2007
4.113
+0.904
28.18%
jan 1, 2008
5.779
+1.665
40.49%
jan 1, 2009
1.409
-4.37
-75.62%
jan 1, 2010
0.765
-0.644
-45.68%
jan 1, 2011
2.986
+2.22
290.07%
jan 1, 2012
-3.231
-6.216
-208.2%
jan 1, 2013
-2.919
+0.312
-9.65%
jan 1, 2014
-1.229
+1.69
-57.9%
jan 1, 2015
1.503
+2.732
-222.34%
Ranking of countries by current statistics by years


Comments: