29
/
en
AIzaSyAYiBZKx7MnpbEhh9jyipgxe19OcubqV5w
April 1, 2024
182952
Macao SAR, China
MAC
true
2
1
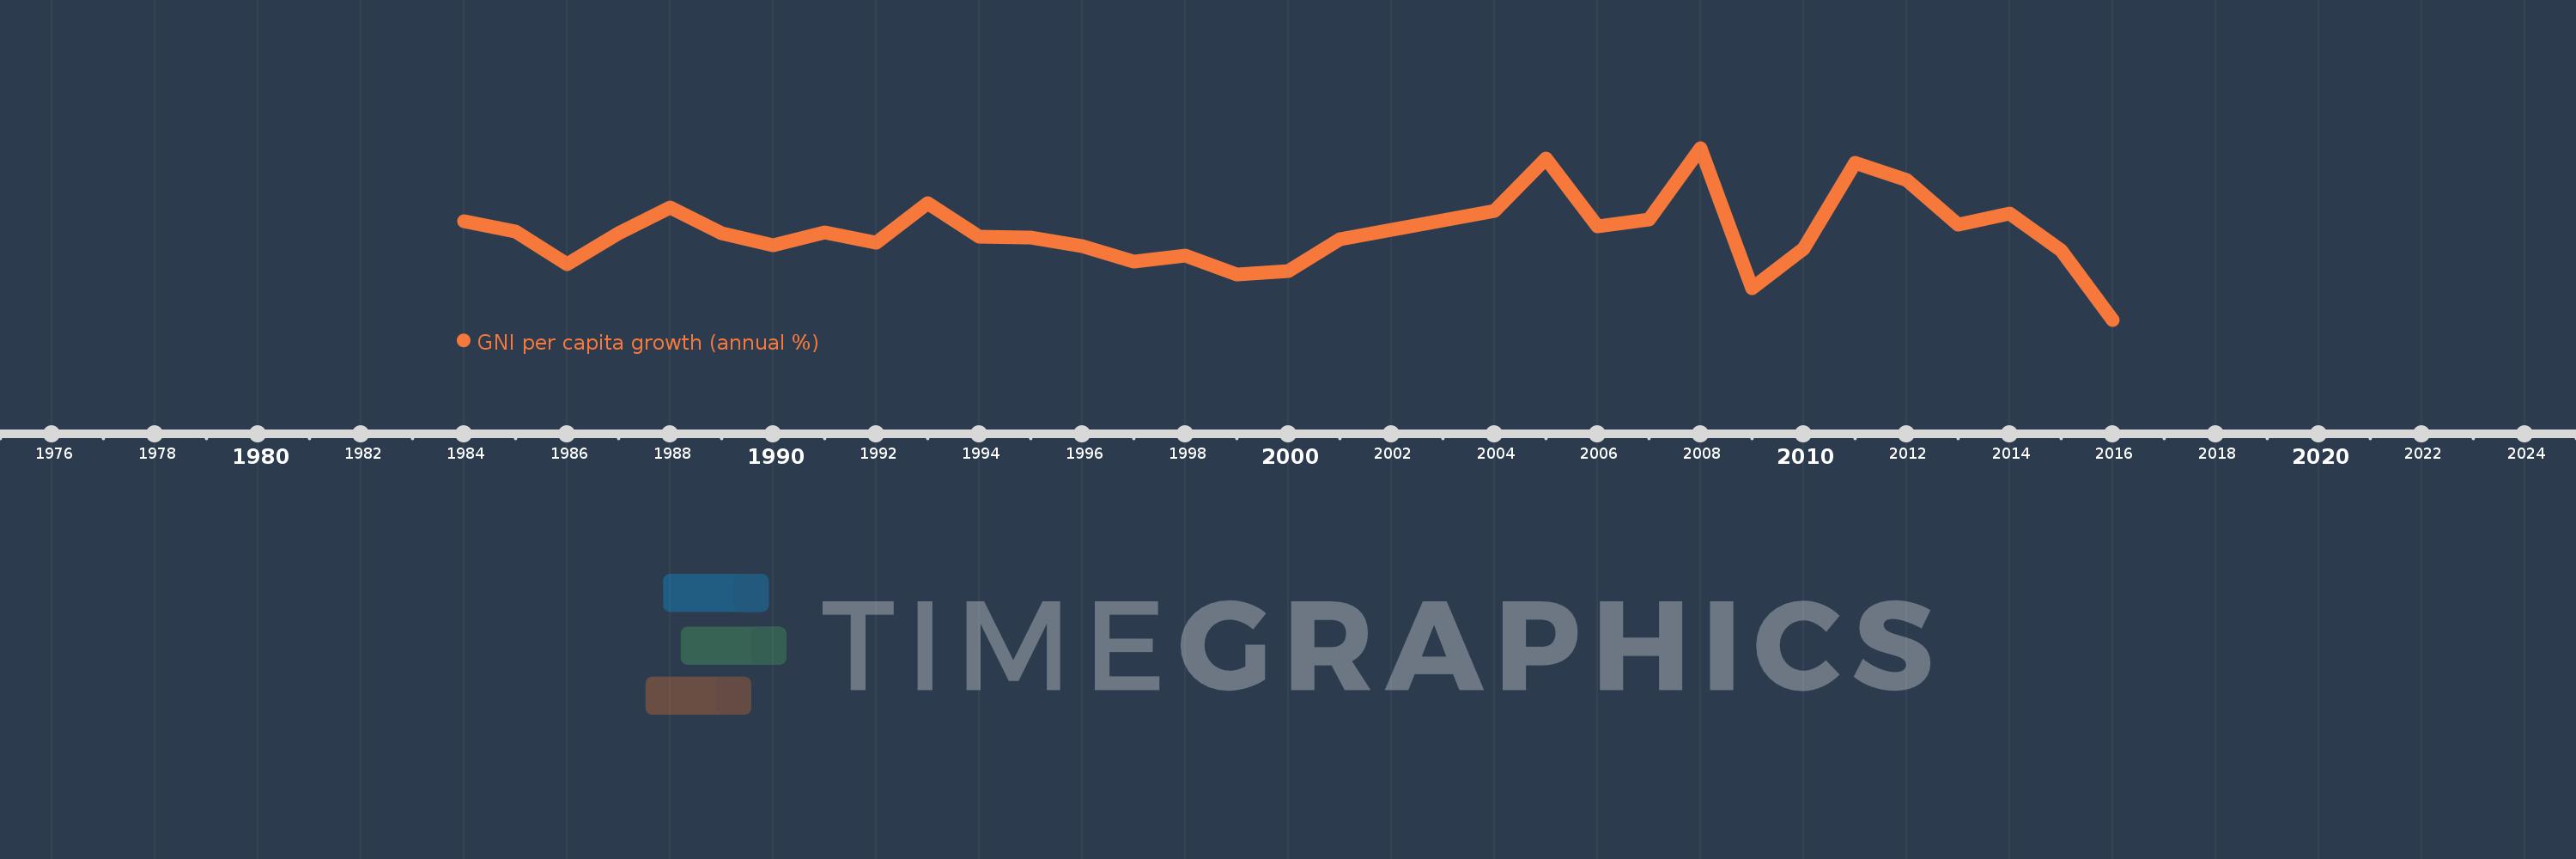
GNI per capita growth (annual %)
2016,2015,2014,2013,2012,2011,2010,2009,2008,2007,2006,2005,2004,2001,2000,1999,1998,1997,1996,1995,1994,1993,1992,1991,1990,1989,1988,1987,1986,1985,1984
This statistics in other country:
AlbaniaAlgeriaAngolaAntigua and BarbudaArab WorldArgentinaArmeniaAustraliaAustriaAzerbaijanBahamas, TheBahrainBangladeshBarbadosBelarusBelgiumBelizeBeninBhutanBoliviaBosnia and HerzegovinaBotswanaBrazilBrunei DarussalamBulgariaBurkina FasoBurundiCabo VerdeCambodiaCameroonCanadaCaribbean small statesCentral Europe and the BalticsChadChileChinaColombiaComorosCongo, Dem. Rep.Congo, Rep.Costa RicaCote d'IvoireCroatiaCubaCyprusCzech RepublicDenmarkDjiboutiDominican RepublicEarly-demographic dividendEast Asia & PacificEast Asia & Pacific (excluding high income)East Asia & Pacific (IDA & IBRD countries)EcuadorEgypt, Arab Rep.El SalvadorEquatorial GuineaEritreaEstoniaEthiopiaEuro areaEurope & Central AsiaEurope & Central Asia (excluding high income)Europe & Central Asia (IDA & IBRD countries)European UnionFijiFinlandFranceGabonGambia, TheGeorgiaGermanyGhanaGreeceGuatemalaGuineaGuinea-BissauHaitiHeavily indebted poor countries (HIPC)High incomeHondurasHong Kong SAR, ChinaHungaryIBRD onlyIcelandIDA & IBRD totalIDA blendIDA onlyIDA totalIndiaIndonesiaIran, Islamic Rep.IrelandIsraelItalyJamaicaJapanJordanKazakhstanKenyaKorea, Rep.KosovoKuwaitKyrgyz RepublicLao PDRLate-demographic dividendLatin America & Caribbean Latin America & Caribbean (excluding high income)Latin America & the Caribbean (IDA & IBRD countries)LatviaLeast developed countries: UN classificationLebanonLiberiaLibyaLithuaniaLow & middle incomeLow incomeLower middle incomeLuxembourgMacao SAR, ChinaMacedonia, FYRMadagascarMalawiMalaysiaMaliMaltaMauritaniaMauritiusMexicoMiddle East & North AfricaMiddle East & North Africa (excluding high income)Middle East & North Africa (IDA & IBRD countries)Middle incomeMoldovaMongoliaMontenegroMoroccoMozambiqueMyanmarNamibiaNepalNetherlandsNew ZealandNicaraguaNigerNigeriaNorth AmericaNorwayOECD membersOmanOther small statesPakistanPanamaPapua New GuineaParaguayPeruPhilippinesPolandPortugalPost-demographic dividendPre-demographic dividendPuerto RicoQatarRomaniaRussian FederationRwandaSamoaSaudi ArabiaSenegalSerbiaSeychellesSierra LeoneSingaporeSlovak RepublicSloveniaSmall statesSomaliaSouth AfricaSouth AsiaSouth Asia (IDA & IBRD)South SudanSpainSri LankaSub-Saharan Africa Sub-Saharan Africa (excluding high income)Sub-Saharan Africa (IDA & IBRD countries)SudanSurinameSwazilandSwedenSwitzerlandSyrian Arab RepublicTajikistanTanzaniaThailandTimor-LesteTogoTrinidad and TobagoTunisiaTurkeyTurkmenistanUgandaUkraineUnited Arab EmiratesUnited KingdomUnited StatesUpper middle incomeUruguayUzbekistanVanuatuVenezuela, RBVietnamWest Bank and GazaWorldZambiaZimbabwe Timeline:
This timeline shows a graph from 1984 to 2016 of Macao SAR, China. No data until 1983. Number of actual observations by date: 31.
Source name:
World Development Indicators
Source organization:
World Bank national accounts data, and OECD National Accounts data files.
Categories, topics:
Economy & Growth
Last updated:
apr 23, 2017
Indicators value changes by year
Minimum:
-16.344
jan 1, 2016
Maximum:
22.729
jan 1, 2008
At the date of observation
Value
Absolute change
Change from previous value
jan 1, 1984
5.975
+5.975
0.0%
jan 1, 1985
3.685
-2.29
-38.33%
jan 1, 1986
-3.71
-7.395
-200.66%
jan 1, 1987
3.273
+6.983
-188.23%
jan 1, 1988
9.163
+5.89
179.96%
jan 1, 1989
3.238
-5.926
-64.67%
jan 1, 1990
0.687
-2.551
-78.78%
jan 1, 1991
3.447
+2.76
401.75%
jan 1, 1992
1.162
-2.285
-66.29%
jan 1, 1993
10.077
+8.915
767.37%
jan 1, 1994
2.484
-7.593
-75.35%
jan 1, 1995
2.265
-0.219
-8.82%
jan 1, 1996
0.382
-1.883
-83.15%
jan 1, 1997
-3.207
-3.588
-940.52%
jan 1, 1998
-1.693
+1.514
-47.21%
jan 1, 1999
-6.066
-4.373
258.34%
jan 1, 2000
-5.362
+0.704
-11.6%
jan 1, 2001
1.882
+7.244
-135.1%
jan 1, 2004
8.361
+6.479
344.27%
jan 1, 2005
20.375
+12.014
143.69%
jan 1, 2006
4.879
-15.496
-76.05%
jan 1, 2007
6.455
+1.575
32.29%
jan 1, 2008
22.729
+16.275
252.15%
jan 1, 2009
-9.093
-31.823
-140.01%
jan 1, 2010
-0.208
+8.885
-97.71%
jan 1, 2011
19.399
+19.607
-9.42K%
jan 1, 2012
15.366
-4.033
-20.79%
jan 1, 2013
5.301
-10.065
-65.5%
jan 1, 2014
7.752
+2.452
46.25%
jan 1, 2015
-0.525
-8.278
-106.77%
jan 1, 2016
-16.344
-15.818
3.01K%
Ranking of countries by current statistics by years


Comments: