29
/
en
AIzaSyAYiBZKx7MnpbEhh9jyipgxe19OcubqV5w
April 1, 2024
99947
Cameroon
CMR
true
2
1
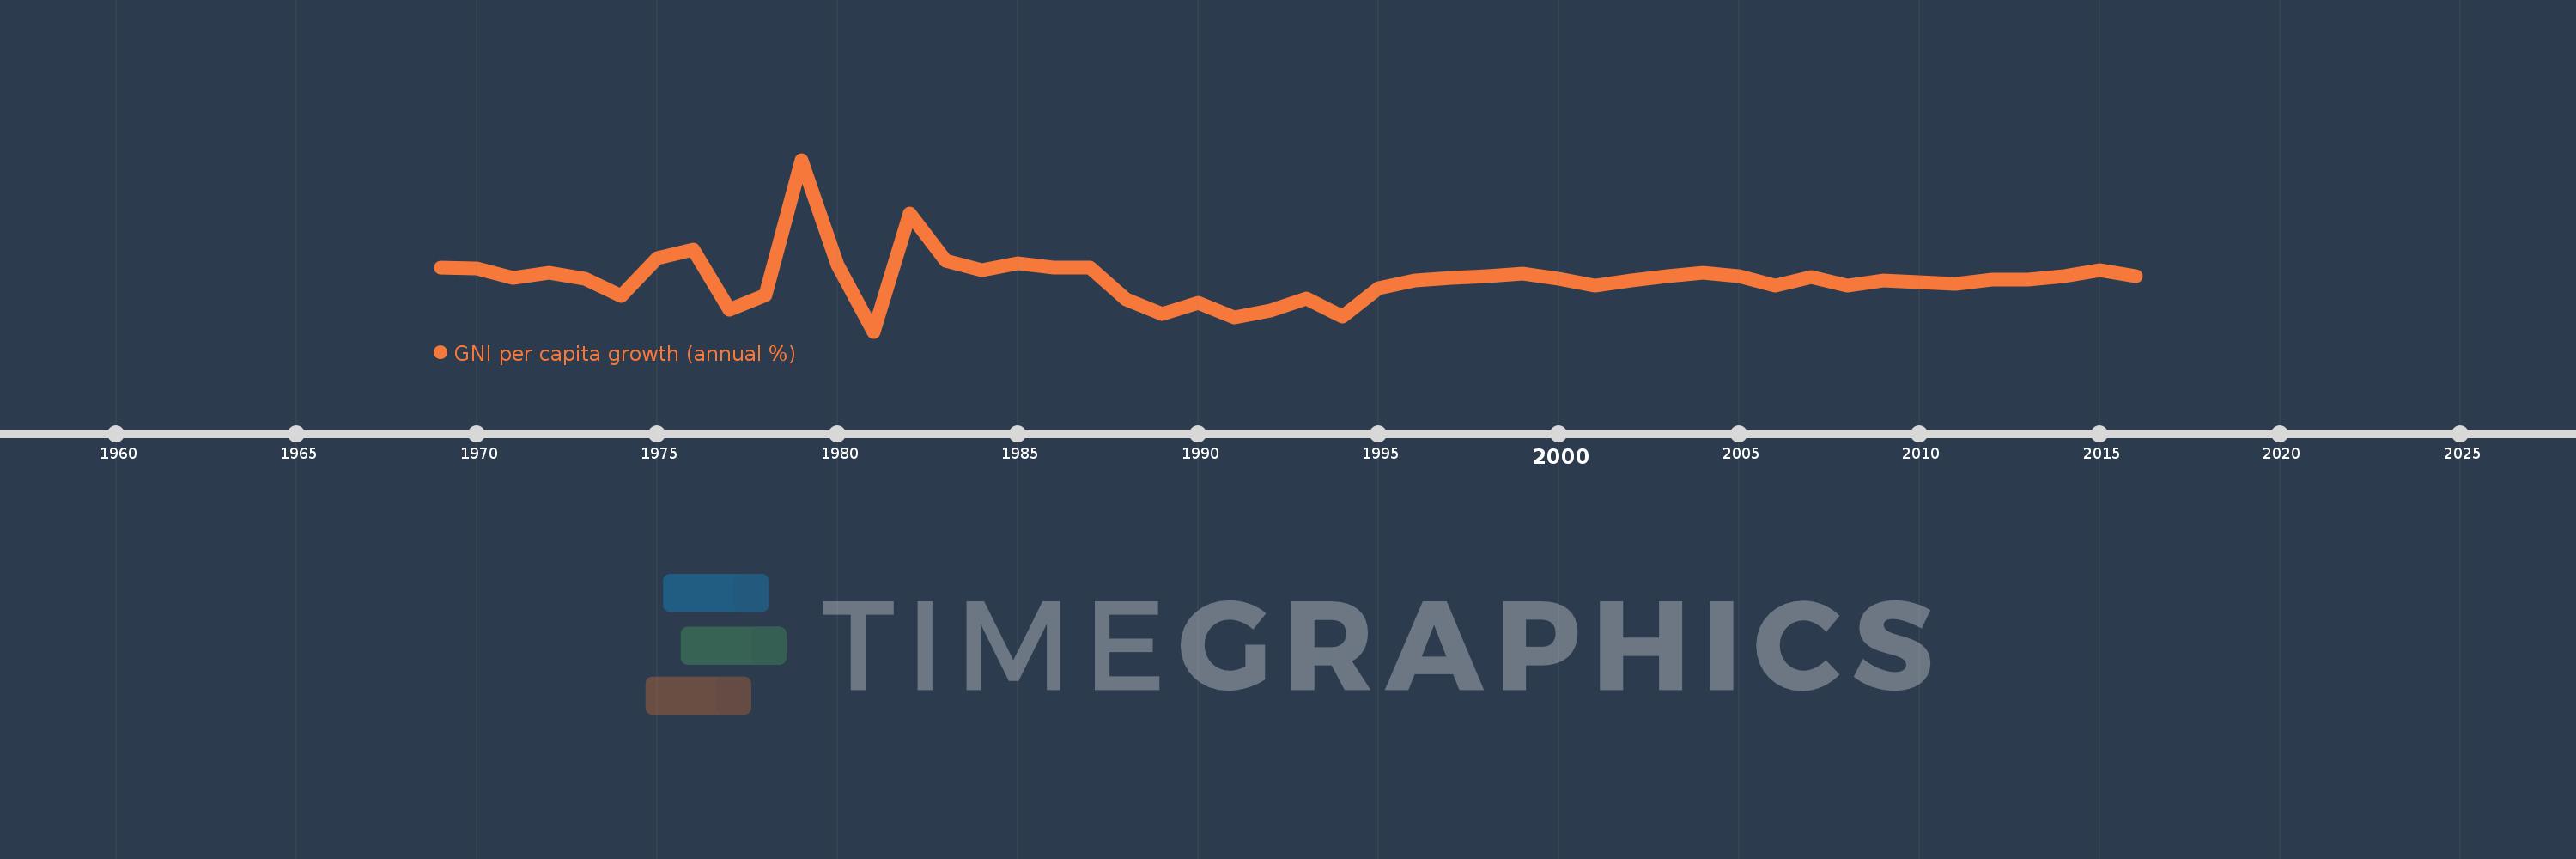
GNI per capita growth (annual %)
2016,2015,2014,2013,2012,2011,2010,2009,2008,2007,2006,2005,2004,2003,2002,2001,2000,1999,1998,1997,1996,1995,1994,1993,1992,1991,1990,1989,1988,1987,1986,1985,1984,1983,1982,1981,1980,1979,1978,1977,1976,1975,1974,1973,1972,1971,1970,1969
This statistics in other country:
AlbaniaAlgeriaAngolaAntigua and BarbudaArab WorldArgentinaArmeniaAustraliaAustriaAzerbaijanBahamas, TheBahrainBangladeshBarbadosBelarusBelgiumBelizeBeninBhutanBoliviaBosnia and HerzegovinaBotswanaBrazilBrunei DarussalamBulgariaBurkina FasoBurundiCabo VerdeCambodiaCameroonCanadaCaribbean small statesCentral Europe and the BalticsChadChileChinaColombiaComorosCongo, Dem. Rep.Congo, Rep.Costa RicaCote d'IvoireCroatiaCubaCyprusCzech RepublicDenmarkDjiboutiDominican RepublicEarly-demographic dividendEast Asia & PacificEast Asia & Pacific (excluding high income)East Asia & Pacific (IDA & IBRD countries)EcuadorEgypt, Arab Rep.El SalvadorEquatorial GuineaEritreaEstoniaEthiopiaEuro areaEurope & Central AsiaEurope & Central Asia (excluding high income)Europe & Central Asia (IDA & IBRD countries)European UnionFijiFinlandFranceGabonGambia, TheGeorgiaGermanyGhanaGreeceGuatemalaGuineaGuinea-BissauHaitiHeavily indebted poor countries (HIPC)High incomeHondurasHong Kong SAR, ChinaHungaryIBRD onlyIcelandIDA & IBRD totalIDA blendIDA onlyIDA totalIndiaIndonesiaIran, Islamic Rep.IrelandIsraelItalyJamaicaJapanJordanKazakhstanKenyaKorea, Rep.KosovoKuwaitKyrgyz RepublicLao PDRLate-demographic dividendLatin America & Caribbean Latin America & Caribbean (excluding high income)Latin America & the Caribbean (IDA & IBRD countries)LatviaLeast developed countries: UN classificationLebanonLiberiaLibyaLithuaniaLow & middle incomeLow incomeLower middle incomeLuxembourgMacao SAR, ChinaMacedonia, FYRMadagascarMalawiMalaysiaMaliMaltaMauritaniaMauritiusMexicoMiddle East & North AfricaMiddle East & North Africa (excluding high income)Middle East & North Africa (IDA & IBRD countries)Middle incomeMoldovaMongoliaMontenegroMoroccoMozambiqueMyanmarNamibiaNepalNetherlandsNew ZealandNicaraguaNigerNigeriaNorth AmericaNorwayOECD membersOmanOther small statesPakistanPanamaPapua New GuineaParaguayPeruPhilippinesPolandPortugalPost-demographic dividendPre-demographic dividendPuerto RicoQatarRomaniaRussian FederationRwandaSamoaSaudi ArabiaSenegalSerbiaSeychellesSierra LeoneSingaporeSlovak RepublicSloveniaSmall statesSomaliaSouth AfricaSouth AsiaSouth Asia (IDA & IBRD)South SudanSpainSri LankaSub-Saharan Africa Sub-Saharan Africa (excluding high income)Sub-Saharan Africa (IDA & IBRD countries)SudanSurinameSwazilandSwedenSwitzerlandSyrian Arab RepublicTajikistanTanzaniaThailandTimor-LesteTogoTrinidad and TobagoTunisiaTurkeyTurkmenistanUgandaUkraineUnited Arab EmiratesUnited KingdomUnited StatesUpper middle incomeUruguayUzbekistanVanuatuVenezuela, RBVietnamWest Bank and GazaWorldZambiaZimbabwe Timeline:
This timeline shows a graph from 1969 to 2016 of Cameroon. No data until 1968. Number of actual observations by date: 48.
Source name:
World Development Indicators
Source organization:
World Bank national accounts data, and OECD National Accounts data files.
Categories, topics:
Economy & Growth
Last updated:
apr 23, 2017
Indicators value changes by year
Minimum:
-15.571
jan 1, 1981
Maximum:
40.606
jan 1, 1979
At the date of observation
Value
Absolute change
Change from previous value
jan 1, 1969
5.418
+5.418
0.0%
jan 1, 1970
4.965
-0.453
-8.37%
jan 1, 1971
1.858
-3.107
-62.58%
jan 1, 1972
3.603
+1.745
93.95%
jan 1, 1973
1.747
-1.856
-51.5%
jan 1, 1974
-3.945
-5.692
-325.76%
jan 1, 1975
8.347
+12.292
-311.58%
jan 1, 1976
11.192
+2.845
34.09%
jan 1, 1977
-8.392
-19.584
-174.99%
jan 1, 1978
-3.734
+4.658
-55.51%
jan 1, 1979
40.606
+44.34
-1.19K%
jan 1, 1980
6.198
-34.408
-84.74%
jan 1, 1981
-15.571
-21.769
-351.24%
jan 1, 1982
22.984
+38.555
-247.61%
jan 1, 1983
7.637
-15.347
-66.77%
jan 1, 1984
4.384
-3.253
-42.6%
jan 1, 1985
6.879
+2.495
56.91%
jan 1, 1986
5.257
-1.622
-23.58%
jan 1, 1987
5.376
+0.12
2.28%
jan 1, 1988
-5.038
-10.415
-193.71%
jan 1, 1989
-9.739
-4.7
93.29%
jan 1, 1990
-6.133
+3.606
-37.03%
jan 1, 1991
-10.984
-4.851
79.1%
jan 1, 1992
-8.635
+2.349
-21.38%
jan 1, 1993
-4.872
+3.763
-43.58%
jan 1, 1994
-10.67
-5.798
119.01%
jan 1, 1995
-1.451
+9.219
-86.4%
jan 1, 1996
1.257
+2.708
-186.6%
jan 1, 1997
2.062
+0.805
64.06%
jan 1, 1998
2.431
+0.37
17.93%
jan 1, 1999
3.489
+1.057
43.49%
jan 1, 2000
1.724
-1.764
-50.58%
jan 1, 2001
-0.584
-2.308
-133.87%
jan 1, 2002
1.074
+1.658
-283.92%
jan 1, 2003
2.498
+1.424
132.54%
jan 1, 2004
3.742
+1.244
49.81%
jan 1, 2005
2.432
-1.309
-34.99%
jan 1, 2006
-0.68
-3.112
-127.96%
jan 1, 2007
2.14
+2.82
-414.7%
jan 1, 2008
-0.412
-2.552
-119.25%
jan 1, 2009
1.033
+1.445
-350.87%
jan 1, 2010
0.654
-0.38
-36.73%
jan 1, 2011
0.028
-0.626
-95.75%
jan 1, 2012
1.511
+1.483
5.34K%
jan 1, 2013
1.406
-0.105
-6.94%
jan 1, 2014
2.511
+1.105
78.55%
jan 1, 2015
4.582
+2.071
82.47%
jan 1, 2016
2.537
-2.045
-44.64%
Ranking of countries by current statistics by years


Comments: