29
/
en
AIzaSyAYiBZKx7MnpbEhh9jyipgxe19OcubqV5w
April 1, 2024
163782
Japan
JPN
true
2
1
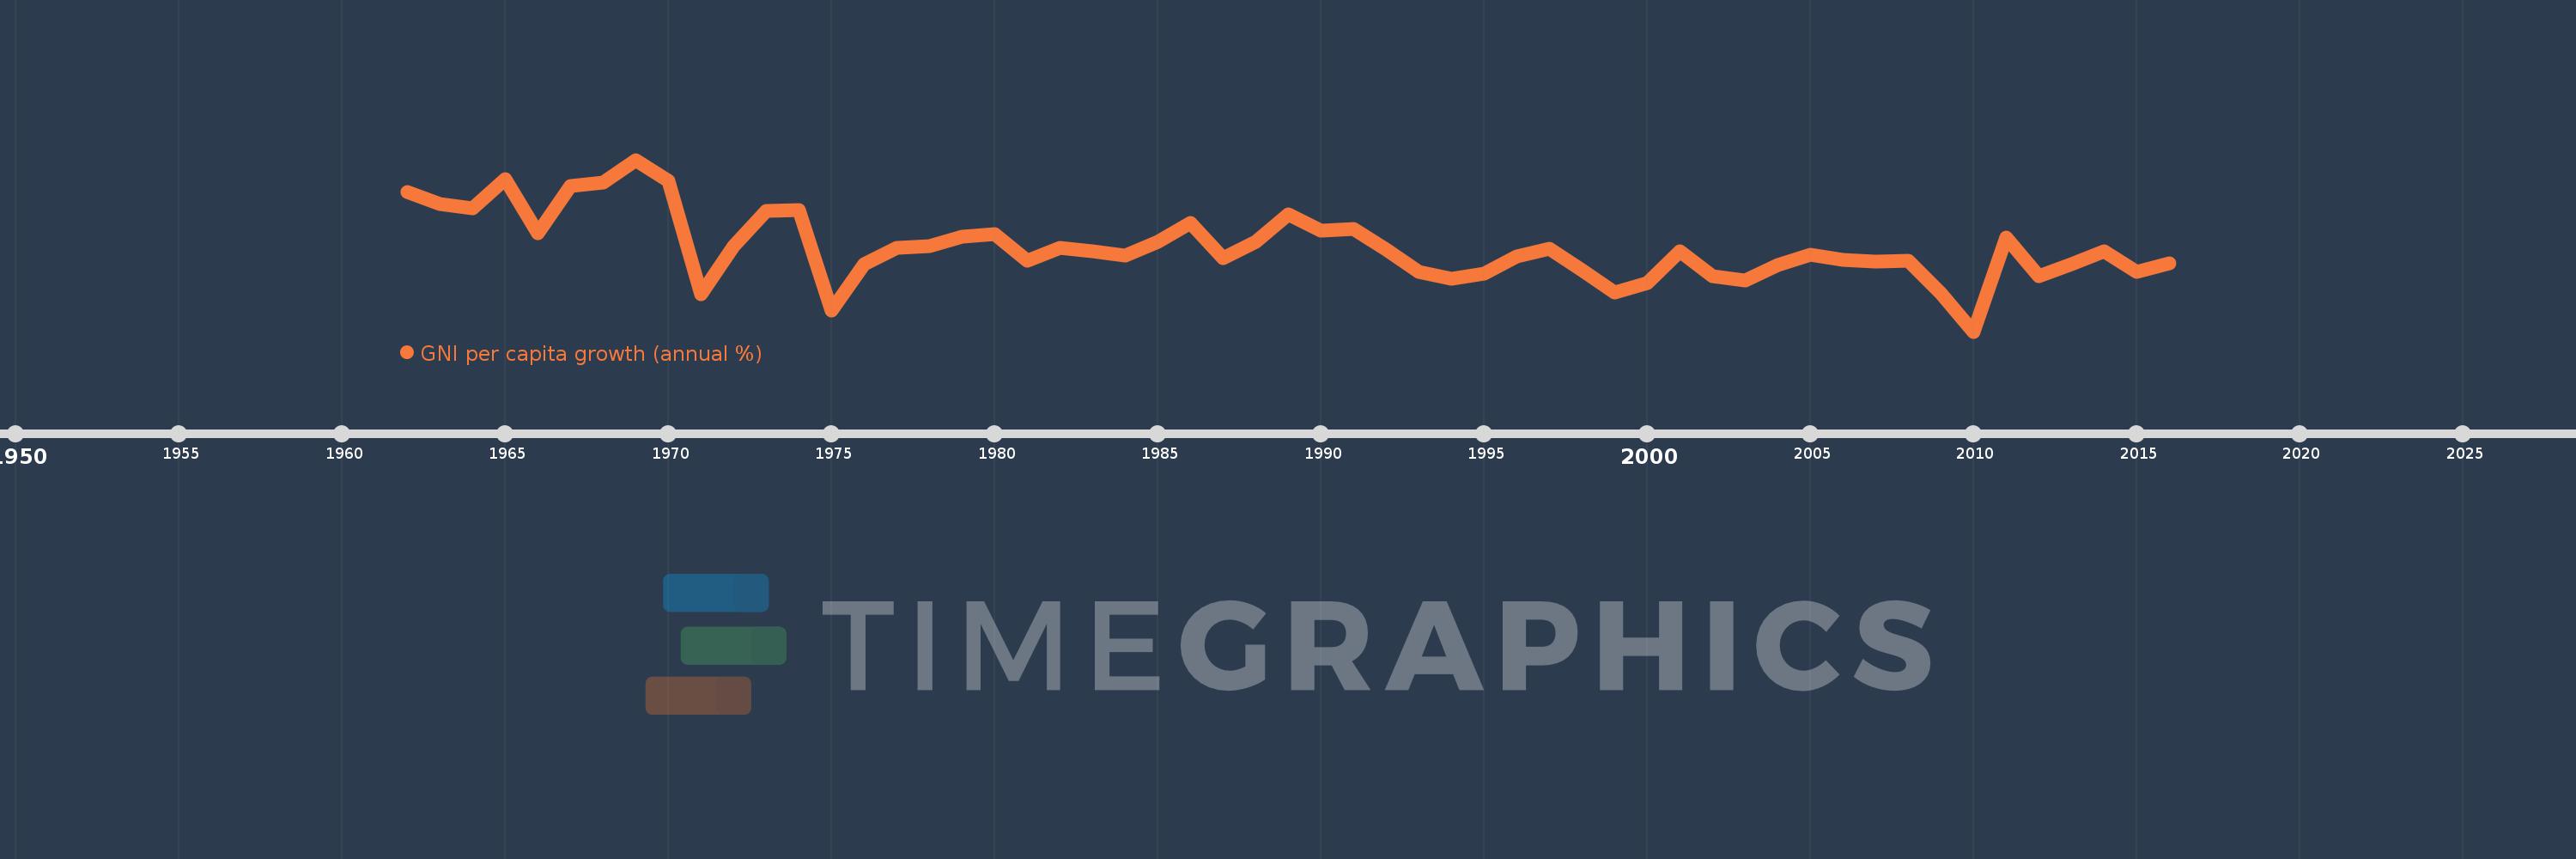
GNI per capita growth (annual %)
2016,2015,2014,2013,2012,2011,2010,2009,2008,2007,2006,2005,2004,2003,2002,2001,2000,1999,1998,1997,1996,1995,1994,1993,1992,1991,1990,1989,1988,1987,1986,1985,1984,1983,1982,1981,1980,1979,1978,1977,1976,1975,1974,1973,1972,1971,1970,1969,1968,1967,1966,1965,1964,1963,1962
This statistics in other country:
AlbaniaAlgeriaAngolaAntigua and BarbudaArab WorldArgentinaArmeniaAustraliaAustriaAzerbaijanBahamas, TheBahrainBangladeshBarbadosBelarusBelgiumBelizeBeninBhutanBoliviaBosnia and HerzegovinaBotswanaBrazilBrunei DarussalamBulgariaBurkina FasoBurundiCabo VerdeCambodiaCameroonCanadaCaribbean small statesCentral Europe and the BalticsChadChileChinaColombiaComorosCongo, Dem. Rep.Congo, Rep.Costa RicaCote d'IvoireCroatiaCubaCyprusCzech RepublicDenmarkDjiboutiDominican RepublicEarly-demographic dividendEast Asia & PacificEast Asia & Pacific (excluding high income)East Asia & Pacific (IDA & IBRD countries)EcuadorEgypt, Arab Rep.El SalvadorEquatorial GuineaEritreaEstoniaEthiopiaEuro areaEurope & Central AsiaEurope & Central Asia (excluding high income)Europe & Central Asia (IDA & IBRD countries)European UnionFijiFinlandFranceGabonGambia, TheGeorgiaGermanyGhanaGreeceGuatemalaGuineaGuinea-BissauHaitiHeavily indebted poor countries (HIPC)High incomeHondurasHong Kong SAR, ChinaHungaryIBRD onlyIcelandIDA & IBRD totalIDA blendIDA onlyIDA totalIndiaIndonesiaIran, Islamic Rep.IrelandIsraelItalyJamaicaJapanJordanKazakhstanKenyaKorea, Rep.KosovoKuwaitKyrgyz RepublicLao PDRLate-demographic dividendLatin America & Caribbean Latin America & Caribbean (excluding high income)Latin America & the Caribbean (IDA & IBRD countries)LatviaLeast developed countries: UN classificationLebanonLiberiaLibyaLithuaniaLow & middle incomeLow incomeLower middle incomeLuxembourgMacao SAR, ChinaMacedonia, FYRMadagascarMalawiMalaysiaMaliMaltaMauritaniaMauritiusMexicoMiddle East & North AfricaMiddle East & North Africa (excluding high income)Middle East & North Africa (IDA & IBRD countries)Middle incomeMoldovaMongoliaMontenegroMoroccoMozambiqueMyanmarNamibiaNepalNetherlandsNew ZealandNicaraguaNigerNigeriaNorth AmericaNorwayOECD membersOmanOther small statesPakistanPanamaPapua New GuineaParaguayPeruPhilippinesPolandPortugalPost-demographic dividendPre-demographic dividendPuerto RicoQatarRomaniaRussian FederationRwandaSamoaSaudi ArabiaSenegalSerbiaSeychellesSierra LeoneSingaporeSlovak RepublicSloveniaSmall statesSomaliaSouth AfricaSouth AsiaSouth Asia (IDA & IBRD)South SudanSpainSri LankaSub-Saharan Africa Sub-Saharan Africa (excluding high income)Sub-Saharan Africa (IDA & IBRD countries)SudanSurinameSwazilandSwedenSwitzerlandSyrian Arab RepublicTajikistanTanzaniaThailandTimor-LesteTogoTrinidad and TobagoTunisiaTurkeyTurkmenistanUgandaUkraineUnited Arab EmiratesUnited KingdomUnited StatesUpper middle incomeUruguayUzbekistanVanuatuVenezuela, RBVietnamWest Bank and GazaWorldZambiaZimbabwe Timeline:
This timeline shows a graph from 1962 to 2016 of Japan. No data until 1961. Number of actual observations by date: 55.
Source name:
World Development Indicators
Source organization:
World Bank national accounts data, and OECD National Accounts data files.
Categories, topics:
Economy & Growth
Last updated:
apr 23, 2017
Indicators value changes by year
Minimum:
-5.532
jan 1, 2010
Maximum:
12.442
jan 1, 1969
At the date of observation
Value
Absolute change
Change from previous value
jan 1, 1962
9.096
+9.096
0.0%
jan 1, 1963
7.842
-1.255
-13.79%
jan 1, 1964
7.335
-0.507
-6.47%
jan 1, 1965
10.416
+3.082
42.01%
jan 1, 1966
4.721
-5.696
-54.68%
jan 1, 1967
9.669
+4.948
104.82%
jan 1, 1968
10.089
+0.421
4.35%
jan 1, 1969
12.442
+2.353
23.32%
jan 1, 1970
10.205
-2.237
-17.98%
jan 1, 1971
-1.647
-11.852
-116.14%
jan 1, 1972
3.443
+5.09
-309.05%
jan 1, 1973
7.067
+3.624
105.26%
jan 1, 1974
7.155
+0.088
1.24%
jan 1, 1975
-3.297
-10.452
-146.08%
jan 1, 1976
1.536
+4.833
-146.6%
jan 1, 1977
3.222
+1.685
109.71%
jan 1, 1978
3.437
+0.215
6.67%
jan 1, 1979
4.415
+0.979
28.48%
jan 1, 1980
4.695
+0.28
6.35%
jan 1, 1981
1.85
-2.846
-60.6%
jan 1, 1982
3.249
+1.399
75.63%
jan 1, 1983
2.9
-0.349
-10.74%
jan 1, 1984
2.452
-0.448
-15.45%
jan 1, 1985
3.88
+1.428
58.24%
jan 1, 1986
5.874
+1.994
51.39%
jan 1, 1987
2.182
-3.692
-62.86%
jan 1, 1988
3.825
+1.643
75.31%
jan 1, 1989
6.714
+2.889
75.52%
jan 1, 1990
5.03
-1.684
-25.08%
jan 1, 1991
5.168
+0.138
2.75%
jan 1, 1992
3.035
-2.133
-41.28%
jan 1, 1993
0.751
-2.284
-75.24%
jan 1, 1994
-0.045
-0.796
-105.99%
jan 1, 1995
0.495
+0.54
-1.2K%
jan 1, 1996
2.37
+1.875
378.9%
jan 1, 1997
3.169
+0.799
33.69%
jan 1, 1998
0.936
-2.232
-70.45%
jan 1, 1999
-1.463
-2.399
-256.23%
jan 1, 2000
-0.443
+1.02
-69.7%
jan 1, 2001
2.84
+3.283
-740.67%
jan 1, 2002
0.262
-2.578
-90.77%
jan 1, 2003
-0.222
-0.484
-184.71%
jan 1, 2004
1.474
+1.696
-764.33%
jan 1, 2005
2.476
+1.001
67.93%
jan 1, 2006
1.935
-0.541
-21.84%
jan 1, 2007
1.791
-0.144
-7.43%
jan 1, 2008
1.909
+0.117
6.56%
jan 1, 2009
-1.552
-3.46
-181.28%
jan 1, 2010
-5.532
-3.981
256.55%
jan 1, 2011
4.296
+9.829
-177.66%
jan 1, 2012
0.293
-4.003
-93.18%
jan 1, 2013
1.543
+1.25
426.43%
jan 1, 2014
2.832
+1.29
83.6%
jan 1, 2015
0.739
-2.094
-73.92%
jan 1, 2016
1.579
+0.84
113.72%
Ranking of countries by current statistics by years


Comments: