29
/
en
AIzaSyAYiBZKx7MnpbEhh9jyipgxe19OcubqV5w
April 1, 2024
112273
Costa Rica
CRI
true
2
1
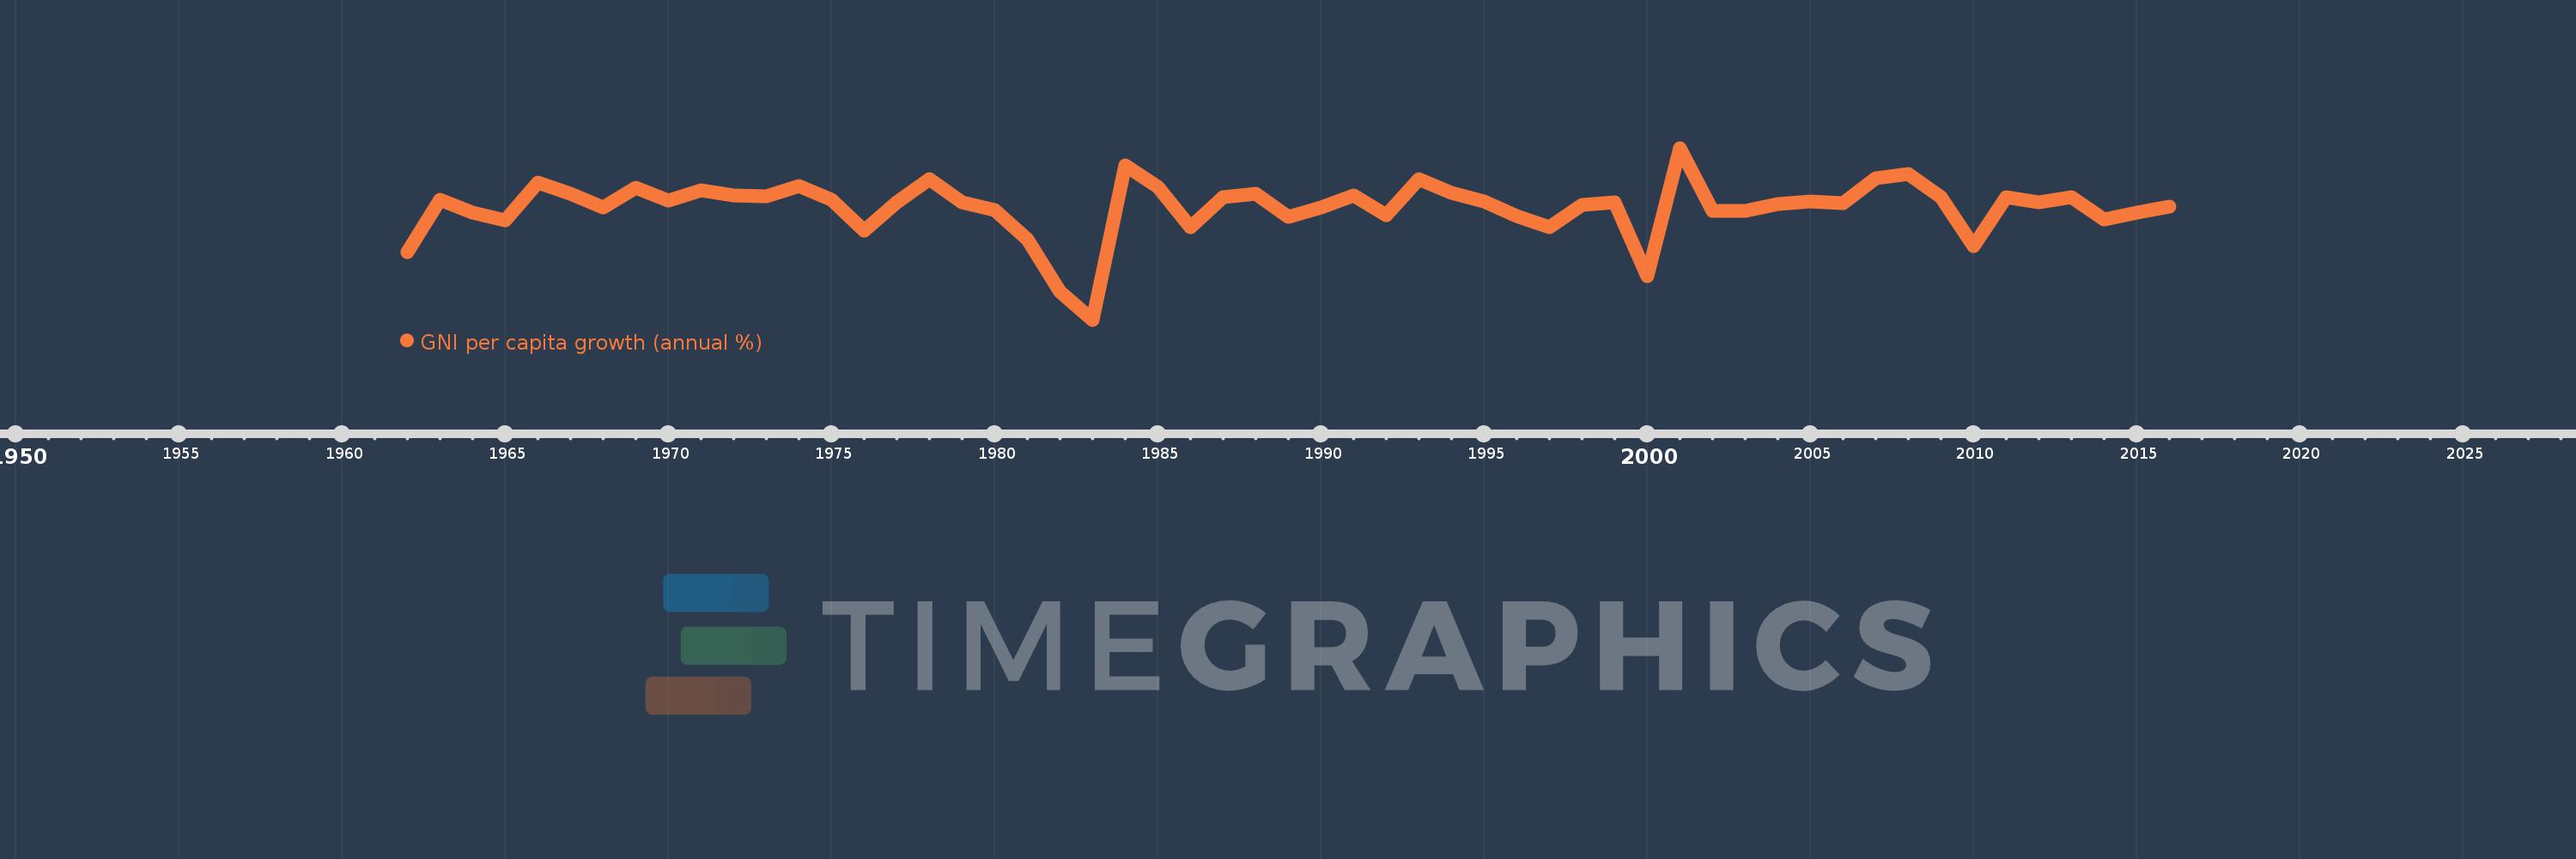
GNI per capita growth (annual %)
2016,2015,2014,2013,2012,2011,2010,2009,2008,2007,2006,2005,2004,2003,2002,2001,2000,1999,1998,1997,1996,1995,1994,1993,1992,1991,1990,1989,1988,1987,1986,1985,1984,1983,1982,1981,1980,1979,1978,1977,1976,1975,1974,1973,1972,1971,1970,1969,1968,1967,1966,1965,1964,1963,1962
This statistics in other country:
AlbaniaAlgeriaAngolaAntigua and BarbudaArab WorldArgentinaArmeniaAustraliaAustriaAzerbaijanBahamas, TheBahrainBangladeshBarbadosBelarusBelgiumBelizeBeninBhutanBoliviaBosnia and HerzegovinaBotswanaBrazilBrunei DarussalamBulgariaBurkina FasoBurundiCabo VerdeCambodiaCameroonCanadaCaribbean small statesCentral Europe and the BalticsChadChileChinaColombiaComorosCongo, Dem. Rep.Congo, Rep.Costa RicaCote d'IvoireCroatiaCubaCyprusCzech RepublicDenmarkDjiboutiDominican RepublicEarly-demographic dividendEast Asia & PacificEast Asia & Pacific (excluding high income)East Asia & Pacific (IDA & IBRD countries)EcuadorEgypt, Arab Rep.El SalvadorEquatorial GuineaEritreaEstoniaEthiopiaEuro areaEurope & Central AsiaEurope & Central Asia (excluding high income)Europe & Central Asia (IDA & IBRD countries)European UnionFijiFinlandFranceGabonGambia, TheGeorgiaGermanyGhanaGreeceGuatemalaGuineaGuinea-BissauHaitiHeavily indebted poor countries (HIPC)High incomeHondurasHong Kong SAR, ChinaHungaryIBRD onlyIcelandIDA & IBRD totalIDA blendIDA onlyIDA totalIndiaIndonesiaIran, Islamic Rep.IrelandIsraelItalyJamaicaJapanJordanKazakhstanKenyaKorea, Rep.KosovoKuwaitKyrgyz RepublicLao PDRLate-demographic dividendLatin America & Caribbean Latin America & Caribbean (excluding high income)Latin America & the Caribbean (IDA & IBRD countries)LatviaLeast developed countries: UN classificationLebanonLiberiaLibyaLithuaniaLow & middle incomeLow incomeLower middle incomeLuxembourgMacao SAR, ChinaMacedonia, FYRMadagascarMalawiMalaysiaMaliMaltaMauritaniaMauritiusMexicoMiddle East & North AfricaMiddle East & North Africa (excluding high income)Middle East & North Africa (IDA & IBRD countries)Middle incomeMoldovaMongoliaMontenegroMoroccoMozambiqueMyanmarNamibiaNepalNetherlandsNew ZealandNicaraguaNigerNigeriaNorth AmericaNorwayOECD membersOmanOther small statesPakistanPanamaPapua New GuineaParaguayPeruPhilippinesPolandPortugalPost-demographic dividendPre-demographic dividendPuerto RicoQatarRomaniaRussian FederationRwandaSamoaSaudi ArabiaSenegalSerbiaSeychellesSierra LeoneSingaporeSlovak RepublicSloveniaSmall statesSomaliaSouth AfricaSouth AsiaSouth Asia (IDA & IBRD)South SudanSpainSri LankaSub-Saharan Africa Sub-Saharan Africa (excluding high income)Sub-Saharan Africa (IDA & IBRD countries)SudanSurinameSwazilandSwedenSwitzerlandSyrian Arab RepublicTajikistanTanzaniaThailandTimor-LesteTogoTrinidad and TobagoTunisiaTurkeyTurkmenistanUgandaUkraineUnited Arab EmiratesUnited KingdomUnited StatesUpper middle incomeUruguayUzbekistanVanuatuVenezuela, RBVietnamWest Bank and GazaWorldZambiaZimbabwe Timeline:
This timeline shows a graph from 1962 to 2016 of Costa Rica. No data until 1961. Number of actual observations by date: 55.
Source name:
World Development Indicators
Source organization:
World Bank national accounts data, and OECD National Accounts data files.
Categories, topics:
Economy & Growth
Last updated:
apr 23, 2017
Indicators value changes by year
Minimum:
-15.023
jan 1, 1983
Maximum:
11.335
jan 1, 2001
At the date of observation
Value
Absolute change
Change from previous value
jan 1, 1962
-4.609
-4.609
0.0%
jan 1, 1963
3.348
+7.957
-172.63%
jan 1, 1964
1.42
-1.928
-57.6%
jan 1, 1965
0.172
-1.248
-87.88%
jan 1, 1966
5.987
+5.814
3.38K%
jan 1, 1967
4.351
-1.636
-27.32%
jan 1, 1968
2.263
-2.088
-48.0%
jan 1, 1969
5.182
+2.919
129.03%
jan 1, 1970
3.206
-1.976
-38.13%
jan 1, 1971
4.831
+1.625
50.69%
jan 1, 1972
4.075
-0.757
-15.66%
jan 1, 1973
3.946
-0.129
-3.17%
jan 1, 1974
5.464
+1.519
38.49%
jan 1, 1975
3.326
-2.138
-39.13%
jan 1, 1976
-1.355
-4.681
-140.75%
jan 1, 1977
2.961
+4.317
-318.51%
jan 1, 1978
6.616
+3.654
123.39%
jan 1, 1979
2.94
-3.676
-55.57%
jan 1, 1980
1.782
-1.158
-39.38%
jan 1, 1981
-2.633
-4.415
-247.76%
jan 1, 1982
-10.737
-8.104
307.8%
jan 1, 1983
-15.023
-4.285
39.91%
jan 1, 1984
8.683
+23.706
-157.8%
jan 1, 1985
5.35
-3.333
-38.38%
jan 1, 1986
-0.859
-6.21
-116.06%
jan 1, 1987
3.83
+4.69
-545.83%
jan 1, 1988
4.341
+0.511
13.34%
jan 1, 1989
0.743
-3.598
-82.88%
jan 1, 1990
2.229
+1.486
199.9%
jan 1, 1991
4.02
+1.791
80.34%
jan 1, 1992
0.986
-3.033
-75.46%
jan 1, 1993
6.489
+5.502
557.82%
jan 1, 1994
4.423
-2.066
-31.84%
jan 1, 1995
3.063
-1.359
-30.74%
jan 1, 1996
0.825
-2.238
-73.06%
jan 1, 1997
-0.777
-1.602
-194.2%
jan 1, 1998
2.649
+3.427
-440.84%
jan 1, 1999
2.93
+0.28
10.58%
jan 1, 2000
-8.301
-11.23
-383.31%
jan 1, 2001
11.335
+19.635
-236.55%
jan 1, 2002
1.691
-9.644
-85.08%
jan 1, 2003
1.659
-0.032
-1.9%
jan 1, 2004
2.709
+1.05
63.33%
jan 1, 2005
3.181
+0.472
17.42%
jan 1, 2006
2.824
-0.357
-11.22%
jan 1, 2007
6.704
+3.88
137.37%
jan 1, 2008
7.278
+0.574
8.56%
jan 1, 2009
3.844
-3.434
-47.18%
jan 1, 2010
-3.738
-7.582
-197.25%
jan 1, 2011
3.758
+7.496
-200.51%
jan 1, 2012
2.988
-0.769
-20.47%
jan 1, 2013
3.825
+0.836
27.99%
jan 1, 2014
0.329
-3.496
-91.4%
jan 1, 2015
1.392
+1.063
323.42%
jan 1, 2016
2.284
+0.892
64.07%
Ranking of countries by current statistics by years


Comments: