29
/
en
AIzaSyAYiBZKx7MnpbEhh9jyipgxe19OcubqV5w
April 1, 2024
195575
Mexico
MEX
true
2
1
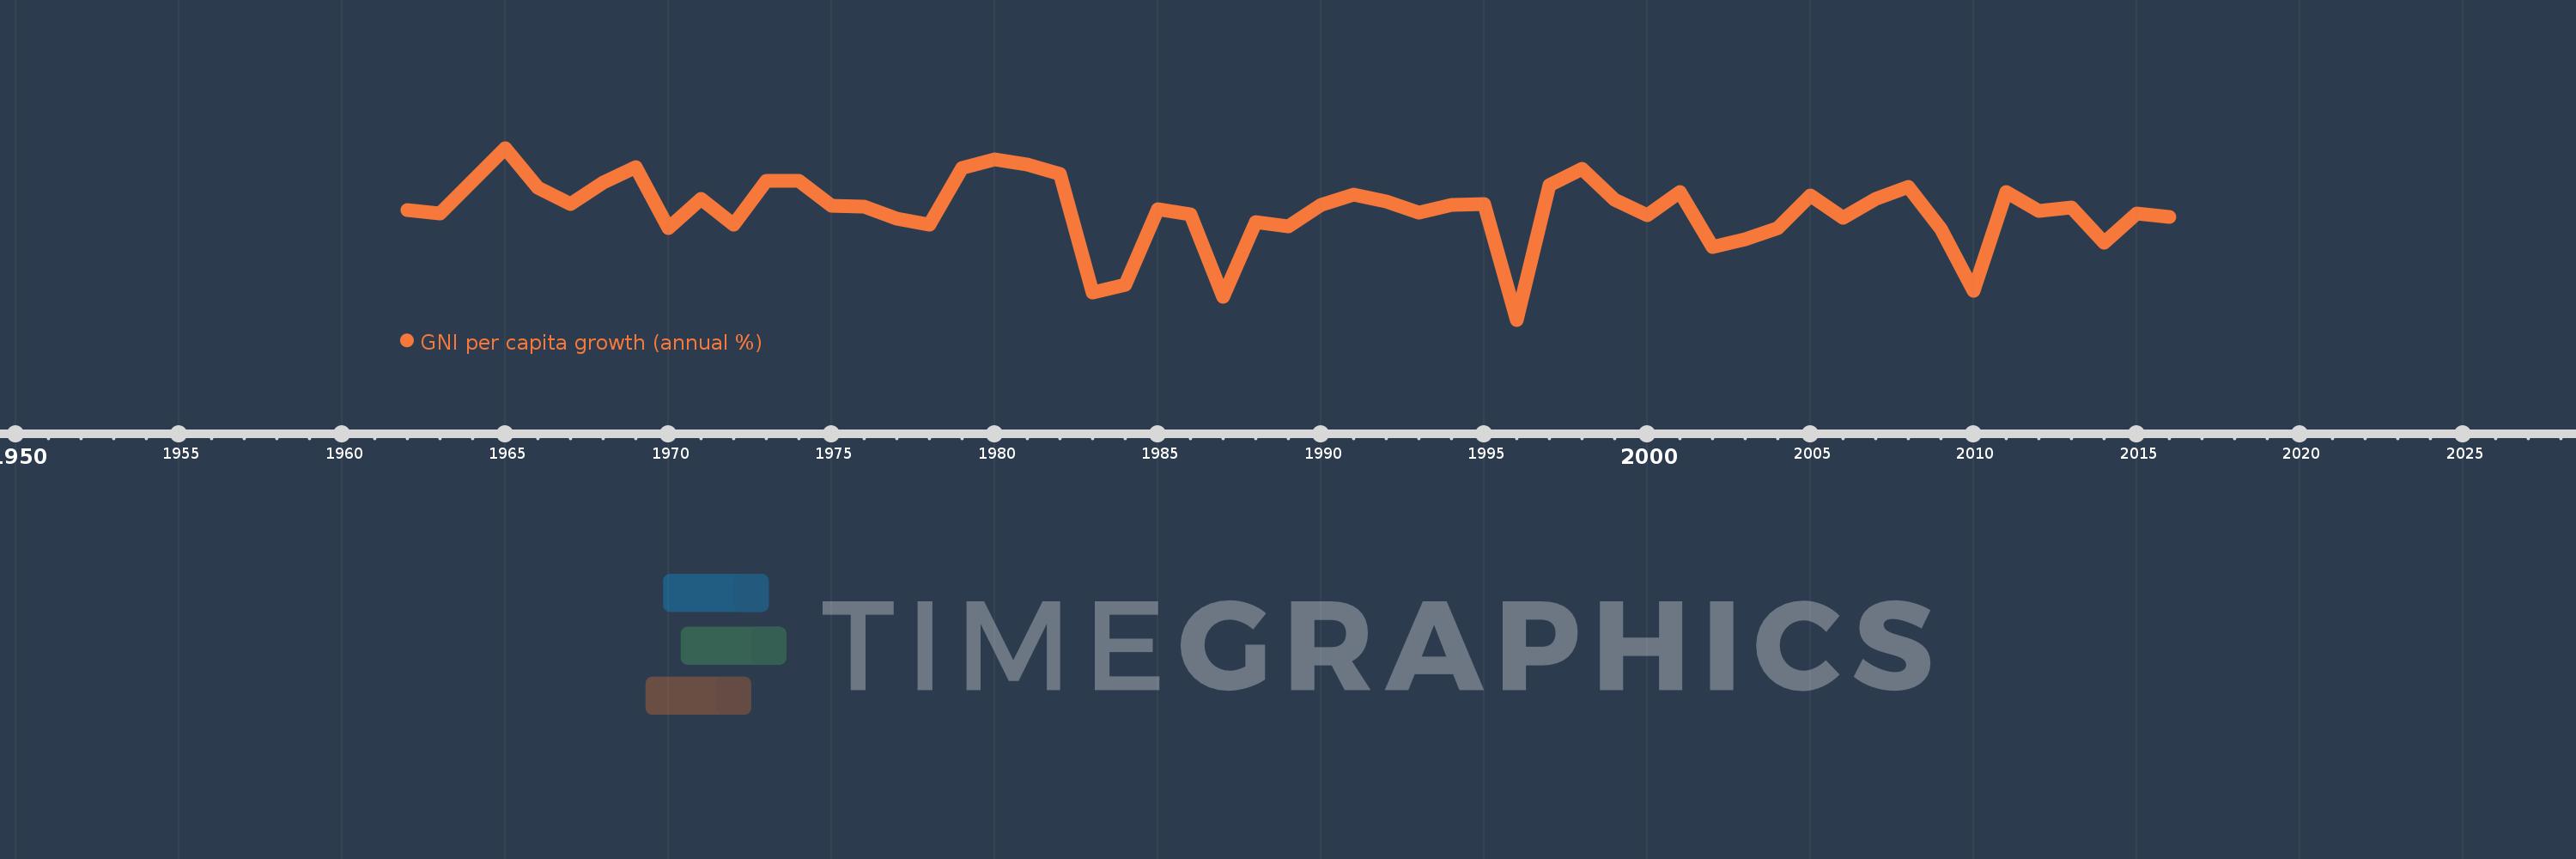
GNI per capita growth (annual %)
2016,2015,2014,2013,2012,2011,2010,2009,2008,2007,2006,2005,2004,2003,2002,2001,2000,1999,1998,1997,1996,1995,1994,1993,1992,1991,1990,1989,1988,1987,1986,1985,1984,1983,1982,1981,1980,1979,1978,1977,1976,1975,1974,1973,1972,1971,1970,1969,1968,1967,1966,1965,1964,1963,1962
This statistics in other country:
AlbaniaAlgeriaAngolaAntigua and BarbudaArab WorldArgentinaArmeniaAustraliaAustriaAzerbaijanBahamas, TheBahrainBangladeshBarbadosBelarusBelgiumBelizeBeninBhutanBoliviaBosnia and HerzegovinaBotswanaBrazilBrunei DarussalamBulgariaBurkina FasoBurundiCabo VerdeCambodiaCameroonCanadaCaribbean small statesCentral Europe and the BalticsChadChileChinaColombiaComorosCongo, Dem. Rep.Congo, Rep.Costa RicaCote d'IvoireCroatiaCubaCyprusCzech RepublicDenmarkDjiboutiDominican RepublicEarly-demographic dividendEast Asia & PacificEast Asia & Pacific (excluding high income)East Asia & Pacific (IDA & IBRD countries)EcuadorEgypt, Arab Rep.El SalvadorEquatorial GuineaEritreaEstoniaEthiopiaEuro areaEurope & Central AsiaEurope & Central Asia (excluding high income)Europe & Central Asia (IDA & IBRD countries)European UnionFijiFinlandFranceGabonGambia, TheGeorgiaGermanyGhanaGreeceGuatemalaGuineaGuinea-BissauHaitiHeavily indebted poor countries (HIPC)High incomeHondurasHong Kong SAR, ChinaHungaryIBRD onlyIcelandIDA & IBRD totalIDA blendIDA onlyIDA totalIndiaIndonesiaIran, Islamic Rep.IrelandIsraelItalyJamaicaJapanJordanKazakhstanKenyaKorea, Rep.KosovoKuwaitKyrgyz RepublicLao PDRLate-demographic dividendLatin America & Caribbean Latin America & Caribbean (excluding high income)Latin America & the Caribbean (IDA & IBRD countries)LatviaLeast developed countries: UN classificationLebanonLiberiaLibyaLithuaniaLow & middle incomeLow incomeLower middle incomeLuxembourgMacao SAR, ChinaMacedonia, FYRMadagascarMalawiMalaysiaMaliMaltaMauritaniaMauritiusMexicoMiddle East & North AfricaMiddle East & North Africa (excluding high income)Middle East & North Africa (IDA & IBRD countries)Middle incomeMoldovaMongoliaMontenegroMoroccoMozambiqueMyanmarNamibiaNepalNetherlandsNew ZealandNicaraguaNigerNigeriaNorth AmericaNorwayOECD membersOmanOther small statesPakistanPanamaPapua New GuineaParaguayPeruPhilippinesPolandPortugalPost-demographic dividendPre-demographic dividendPuerto RicoQatarRomaniaRussian FederationRwandaSamoaSaudi ArabiaSenegalSerbiaSeychellesSierra LeoneSingaporeSlovak RepublicSloveniaSmall statesSomaliaSouth AfricaSouth AsiaSouth Asia (IDA & IBRD)South SudanSpainSri LankaSub-Saharan Africa Sub-Saharan Africa (excluding high income)Sub-Saharan Africa (IDA & IBRD countries)SudanSurinameSwazilandSwedenSwitzerlandSyrian Arab RepublicTajikistanTanzaniaThailandTimor-LesteTogoTrinidad and TobagoTunisiaTurkeyTurkmenistanUgandaUkraineUnited Arab EmiratesUnited KingdomUnited StatesUpper middle incomeUruguayUzbekistanVanuatuVenezuela, RBVietnamWest Bank and GazaWorldZambiaZimbabwe Timeline:
This timeline shows a graph from 1962 to 2016 of Mexico. No data until 1961. Number of actual observations by date: 55.
Source name:
World Development Indicators
Source organization:
World Bank national accounts data, and OECD National Accounts data files.
Categories, topics:
Economy & Growth
Last updated:
apr 23, 2017
Indicators value changes by year
Minimum:
-8.786
jan 1, 1996
At the date of observation
Value
Absolute change
Change from previous value
jan 1, 1962
1.89
+1.89
0.0%
jan 1, 1963
1.615
-0.276
-14.58%
jan 1, 1964
4.772
+3.157
195.55%
jan 1, 1965
7.963
+3.191
66.86%
jan 1, 1966
4.064
-3.899
-48.96%
jan 1, 1967
2.535
-1.53
-37.64%
jan 1, 1968
4.601
+2.066
81.53%
jan 1, 1969
6.062
+1.461
31.75%
jan 1, 1970
0.189
-5.873
-96.89%
jan 1, 1971
2.967
+2.779
1.47K%
jan 1, 1972
0.446
-2.522
-84.97%
jan 1, 1973
4.782
+4.336
972.33%
jan 1, 1974
4.754
-0.028
-0.59%
jan 1, 1975
2.307
-2.447
-51.47%
jan 1, 1976
2.221
-0.086
-3.71%
jan 1, 1977
1.105
-1.117
-50.26%
jan 1, 1978
0.448
-0.657
-59.45%
jan 1, 1979
6.038
+5.59
1.25K%
jan 1, 1980
6.809
+0.771
12.78%
jan 1, 1981
6.314
-0.495
-7.27%
jan 1, 1982
5.451
-0.864
-13.68%
jan 1, 1983
-6.105
-11.555
-212.0%
jan 1, 1984
-5.345
+0.76
-12.44%
jan 1, 1985
1.981
+7.326
-137.07%
jan 1, 1986
1.527
-0.454
-22.91%
jan 1, 1987
-6.544
-8.071
-528.48%
jan 1, 1988
0.72
+7.264
-111.01%
jan 1, 1989
0.298
-0.423
-58.68%
jan 1, 1990
2.38
+2.083
699.71%
jan 1, 1991
3.428
+1.047
44.0%
jan 1, 1992
2.738
-0.689
-20.11%
jan 1, 1993
1.692
-1.046
-38.2%
jan 1, 1994
2.434
+0.741
43.81%
jan 1, 1995
2.533
+0.099
4.06%
jan 1, 1996
-8.786
-11.318
-446.92%
jan 1, 1997
4.32
+13.106
-149.17%
jan 1, 1998
5.949
+1.629
37.7%
jan 1, 1999
2.939
-3.01
-50.6%
jan 1, 2000
1.402
-1.537
-52.3%
jan 1, 2001
3.7
+2.298
163.95%
jan 1, 2002
-1.694
-5.394
-145.78%
jan 1, 2003
-0.942
+0.752
-44.37%
jan 1, 2004
0.148
+1.091
-115.76%
jan 1, 2005
3.357
+3.208
2.16K%
jan 1, 2006
1.175
-2.182
-65.0%
jan 1, 2007
3.018
+1.843
156.85%
jan 1, 2008
4.173
+1.156
38.29%
jan 1, 2009
0.039
-4.134
-99.07%
jan 1, 2010
-5.992
-6.031
-15.48K%
jan 1, 2011
3.652
+9.644
-160.94%
jan 1, 2012
1.8
-1.852
-50.71%
jan 1, 2013
2.13
+0.33
18.36%
jan 1, 2014
-1.262
-3.392
-159.24%
jan 1, 2015
1.583
+2.845
-225.45%
jan 1, 2016
1.219
-0.365
-23.03%
Ranking of countries by current statistics by years


Comments: