29
/
en
AIzaSyAYiBZKx7MnpbEhh9jyipgxe19OcubqV5w
April 1, 2024
194251
Mauritius
MUS
true
2
1
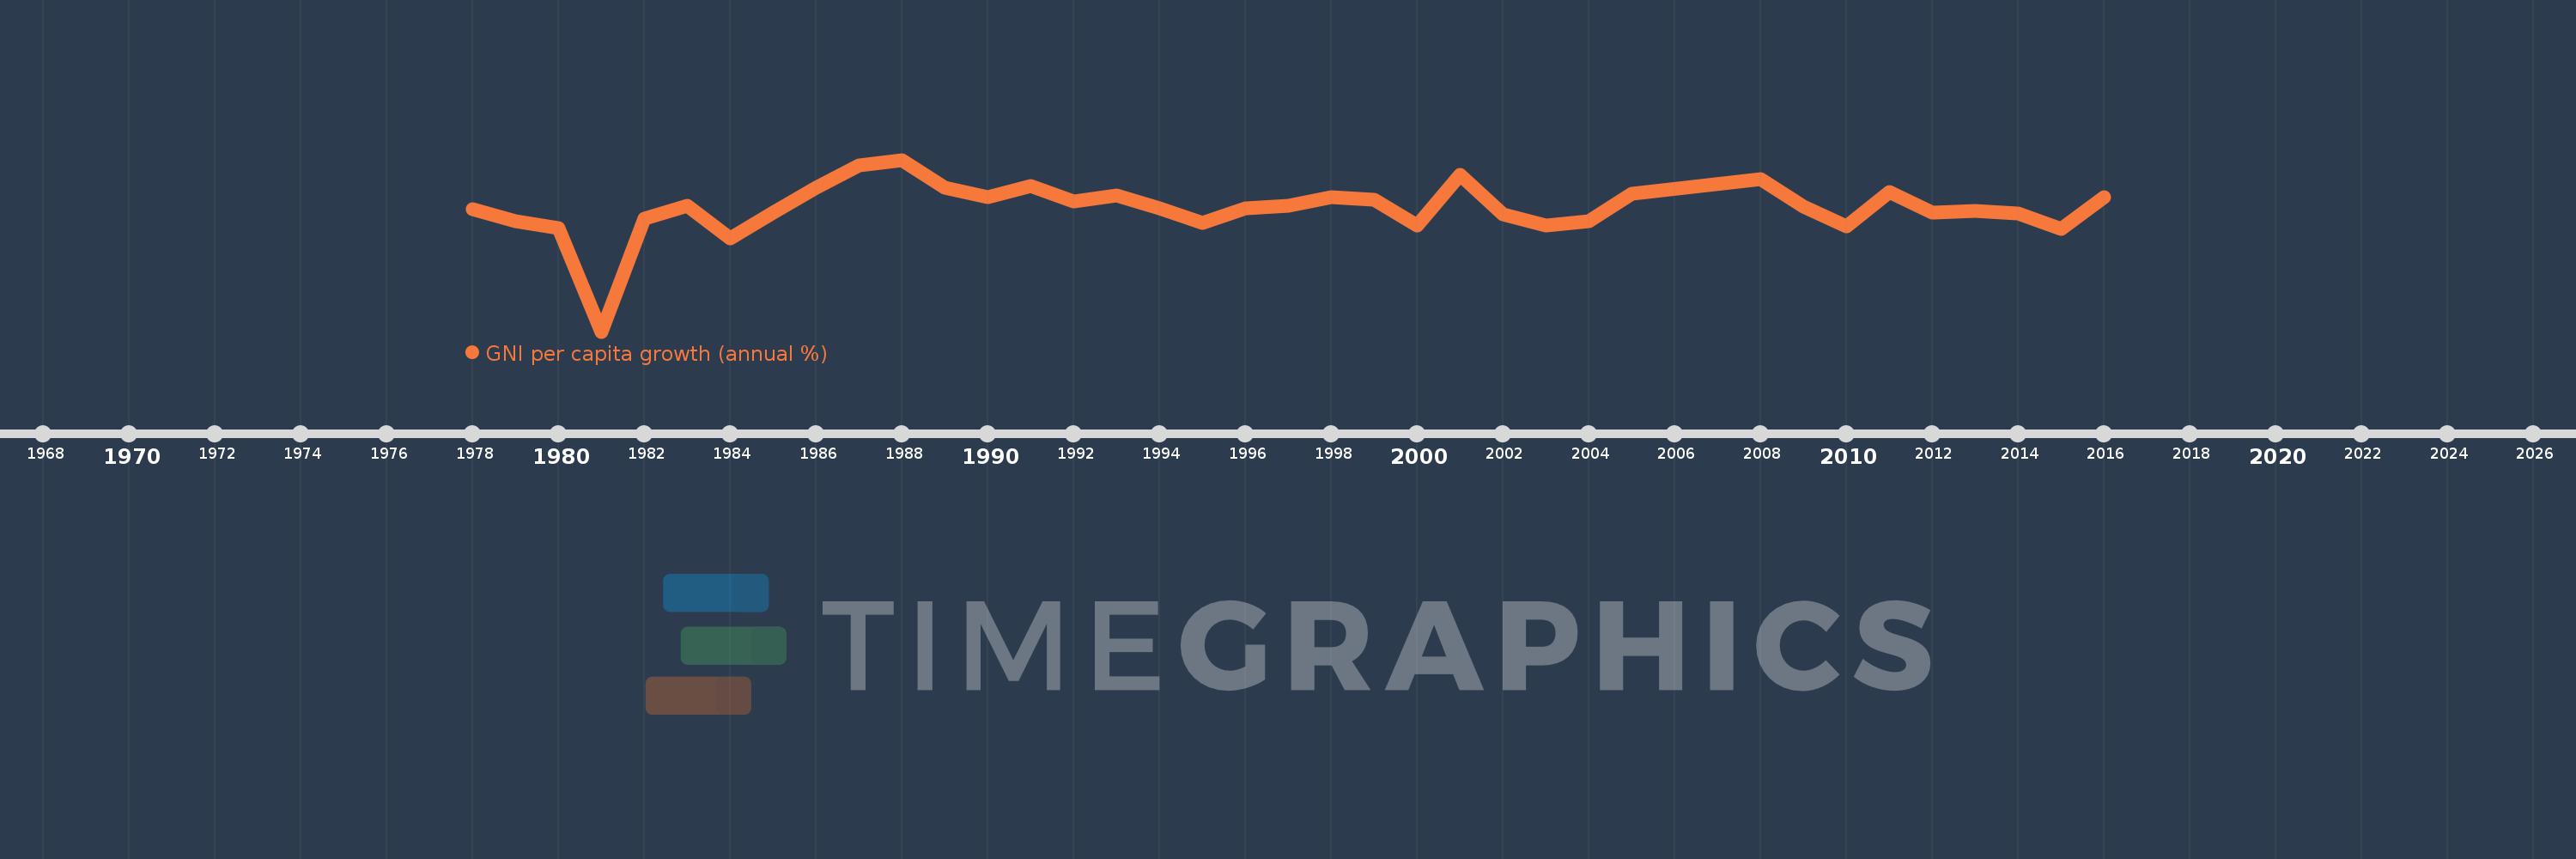
GNI per capita growth (annual %)
2016,2015,2014,2013,2012,2011,2010,2009,2008,2005,2004,2003,2002,2001,2000,1999,1998,1997,1996,1995,1994,1993,1992,1991,1990,1989,1988,1987,1986,1985,1984,1983,1982,1981,1980,1979,1978
This statistics in other country:
AlbaniaAlgeriaAngolaAntigua and BarbudaArab WorldArgentinaArmeniaAustraliaAustriaAzerbaijanBahamas, TheBahrainBangladeshBarbadosBelarusBelgiumBelizeBeninBhutanBoliviaBosnia and HerzegovinaBotswanaBrazilBrunei DarussalamBulgariaBurkina FasoBurundiCabo VerdeCambodiaCameroonCanadaCaribbean small statesCentral Europe and the BalticsChadChileChinaColombiaComorosCongo, Dem. Rep.Congo, Rep.Costa RicaCote d'IvoireCroatiaCubaCyprusCzech RepublicDenmarkDjiboutiDominican RepublicEarly-demographic dividendEast Asia & PacificEast Asia & Pacific (excluding high income)East Asia & Pacific (IDA & IBRD countries)EcuadorEgypt, Arab Rep.El SalvadorEquatorial GuineaEritreaEstoniaEthiopiaEuro areaEurope & Central AsiaEurope & Central Asia (excluding high income)Europe & Central Asia (IDA & IBRD countries)European UnionFijiFinlandFranceGabonGambia, TheGeorgiaGermanyGhanaGreeceGuatemalaGuineaGuinea-BissauHaitiHeavily indebted poor countries (HIPC)High incomeHondurasHong Kong SAR, ChinaHungaryIBRD onlyIcelandIDA & IBRD totalIDA blendIDA onlyIDA totalIndiaIndonesiaIran, Islamic Rep.IrelandIsraelItalyJamaicaJapanJordanKazakhstanKenyaKorea, Rep.KosovoKuwaitKyrgyz RepublicLao PDRLate-demographic dividendLatin America & Caribbean Latin America & Caribbean (excluding high income)Latin America & the Caribbean (IDA & IBRD countries)LatviaLeast developed countries: UN classificationLebanonLiberiaLibyaLithuaniaLow & middle incomeLow incomeLower middle incomeLuxembourgMacao SAR, ChinaMacedonia, FYRMadagascarMalawiMalaysiaMaliMaltaMauritaniaMauritiusMexicoMiddle East & North AfricaMiddle East & North Africa (excluding high income)Middle East & North Africa (IDA & IBRD countries)Middle incomeMoldovaMongoliaMontenegroMoroccoMozambiqueMyanmarNamibiaNepalNetherlandsNew ZealandNicaraguaNigerNigeriaNorth AmericaNorwayOECD membersOmanOther small statesPakistanPanamaPapua New GuineaParaguayPeruPhilippinesPolandPortugalPost-demographic dividendPre-demographic dividendPuerto RicoQatarRomaniaRussian FederationRwandaSamoaSaudi ArabiaSenegalSerbiaSeychellesSierra LeoneSingaporeSlovak RepublicSloveniaSmall statesSomaliaSouth AfricaSouth AsiaSouth Asia (IDA & IBRD)South SudanSpainSri LankaSub-Saharan Africa Sub-Saharan Africa (excluding high income)Sub-Saharan Africa (IDA & IBRD countries)SudanSurinameSwazilandSwedenSwitzerlandSyrian Arab RepublicTajikistanTanzaniaThailandTimor-LesteTogoTrinidad and TobagoTunisiaTurkeyTurkmenistanUgandaUkraineUnited Arab EmiratesUnited KingdomUnited StatesUpper middle incomeUruguayUzbekistanVanuatuVenezuela, RBVietnamWest Bank and GazaWorldZambiaZimbabwe Timeline:
This timeline shows a graph from 1978 to 2016 of Mauritius. No data until 1977. Number of actual observations by date: 37.
Source name:
World Development Indicators
Source organization:
World Bank national accounts data, and OECD National Accounts data files.
Categories, topics:
Economy & Growth
Last updated:
apr 23, 2017
Indicators value changes by year
Minimum:
-12.137
jan 1, 1981
At the date of observation
Value
Absolute change
Change from previous value
jan 1, 1978
3.49
+3.49
0.0%
jan 1, 1979
1.982
-1.508
-43.2%
jan 1, 1980
1.062
-0.92
-46.41%
jan 1, 1981
-12.137
-13.199
-1.24K%
jan 1, 1982
2.354
+14.491
-119.4%
jan 1, 1983
3.999
+1.645
69.85%
jan 1, 1984
-0.213
-4.211
-105.32%
jan 1, 1985
3.034
+3.246
-1.53K%
jan 1, 1986
6.28
+3.247
107.01%
jan 1, 1987
9.067
+2.786
44.36%
jan 1, 1988
9.824
+0.757
8.35%
jan 1, 1989
6.269
-3.555
-36.19%
jan 1, 1990
5.088
-1.181
-18.84%
jan 1, 1991
6.459
+1.371
26.95%
jan 1, 1992
4.545
-1.915
-29.64%
jan 1, 1993
5.284
+0.739
16.27%
jan 1, 1994
3.577
-1.708
-32.31%
jan 1, 1995
1.803
-1.773
-49.58%
jan 1, 1996
3.641
+1.838
101.92%
jan 1, 1997
3.896
+0.255
6.99%
jan 1, 1998
5.04
+1.144
29.36%
jan 1, 1999
4.686
-0.354
-7.02%
jan 1, 2000
1.419
-3.267
-69.72%
jan 1, 2001
7.851
+6.432
453.36%
jan 1, 2002
2.846
-5.005
-63.75%
jan 1, 2003
1.392
-1.454
-51.09%
jan 1, 2004
1.98
+0.588
42.22%
jan 1, 2005
5.455
+3.476
175.59%
jan 1, 2008
7.35
+1.895
34.73%
jan 1, 2009
3.841
-3.509
-47.75%
jan 1, 2010
1.278
-2.563
-66.72%
jan 1, 2011
5.693
+4.415
345.4%
jan 1, 2012
3.048
-2.645
-46.47%
jan 1, 2013
3.27
+0.222
7.28%
jan 1, 2014
3.004
-0.265
-8.12%
jan 1, 2015
0.969
-2.035
-67.75%
jan 1, 2016
5.047
+4.078
420.94%
Ranking of countries by current statistics by years


Comments: