29
/
en
AIzaSyAYiBZKx7MnpbEhh9jyipgxe19OcubqV5w
April 1, 2024
256361
Sweden
SWE
true
2
1
GNI per capita growth (annual %)
2016,2015,2014,2013,2012,2011,2010,2009,2008,2007,2006,2005,2004,2003,2002,2001,2000,1999,1998,1997,1996,1995,1994,1993,1992,1991,1990,1989,1988,1987,1986,1985,1984,1983,1982,1981,1980,1979,1978,1977,1976,1975,1974,1973,1972,1971,1970,1969,1968,1967,1966,1965,1964,1963,1962
This statistics in other country:
AlbaniaAlgeriaAngolaAntigua and BarbudaArab WorldArgentinaArmeniaAustraliaAustriaAzerbaijanBahamas, TheBahrainBangladeshBarbadosBelarusBelgiumBelizeBeninBhutanBoliviaBosnia and HerzegovinaBotswanaBrazilBrunei DarussalamBulgariaBurkina FasoBurundiCabo VerdeCambodiaCameroonCanadaCaribbean small statesCentral Europe and the BalticsChadChileChinaColombiaComorosCongo, Dem. Rep.Congo, Rep.Costa RicaCote d'IvoireCroatiaCubaCyprusCzech RepublicDenmarkDjiboutiDominican RepublicEarly-demographic dividendEast Asia & PacificEast Asia & Pacific (excluding high income)East Asia & Pacific (IDA & IBRD countries)EcuadorEgypt, Arab Rep.El SalvadorEquatorial GuineaEritreaEstoniaEthiopiaEuro areaEurope & Central AsiaEurope & Central Asia (excluding high income)Europe & Central Asia (IDA & IBRD countries)European UnionFijiFinlandFranceGabonGambia, TheGeorgiaGermanyGhanaGreeceGuatemalaGuineaGuinea-BissauHaitiHeavily indebted poor countries (HIPC)High incomeHondurasHong Kong SAR, ChinaHungaryIBRD onlyIcelandIDA & IBRD totalIDA blendIDA onlyIDA totalIndiaIndonesiaIran, Islamic Rep.IrelandIsraelItalyJamaicaJapanJordanKazakhstanKenyaKorea, Rep.KosovoKuwaitKyrgyz RepublicLao PDRLate-demographic dividendLatin America & Caribbean Latin America & Caribbean (excluding high income)Latin America & the Caribbean (IDA & IBRD countries)LatviaLeast developed countries: UN classificationLebanonLiberiaLibyaLithuaniaLow & middle incomeLow incomeLower middle incomeLuxembourgMacao SAR, ChinaMacedonia, FYRMadagascarMalawiMalaysiaMaliMaltaMauritaniaMauritiusMexicoMiddle East & North AfricaMiddle East & North Africa (excluding high income)Middle East & North Africa (IDA & IBRD countries)Middle incomeMoldovaMongoliaMontenegroMoroccoMozambiqueMyanmarNamibiaNepalNetherlandsNew ZealandNicaraguaNigerNigeriaNorth AmericaNorwayOECD membersOmanOther small statesPakistanPanamaPapua New GuineaParaguayPeruPhilippinesPolandPortugalPost-demographic dividendPre-demographic dividendPuerto RicoQatarRomaniaRussian FederationRwandaSamoaSaudi ArabiaSenegalSerbiaSeychellesSierra LeoneSingaporeSlovak RepublicSloveniaSmall statesSomaliaSouth AfricaSouth AsiaSouth Asia (IDA & IBRD)South SudanSpainSri LankaSub-Saharan Africa Sub-Saharan Africa (excluding high income)Sub-Saharan Africa (IDA & IBRD countries)SudanSurinameSwazilandSwedenSwitzerlandSyrian Arab RepublicTajikistanTanzaniaThailandTimor-LesteTogoTrinidad and TobagoTunisiaTurkeyTurkmenistanUgandaUkraineUnited Arab EmiratesUnited KingdomUnited StatesUpper middle incomeUruguayUzbekistanVanuatuVenezuela, RBVietnamWest Bank and GazaWorldZambiaZimbabwe Timeline:
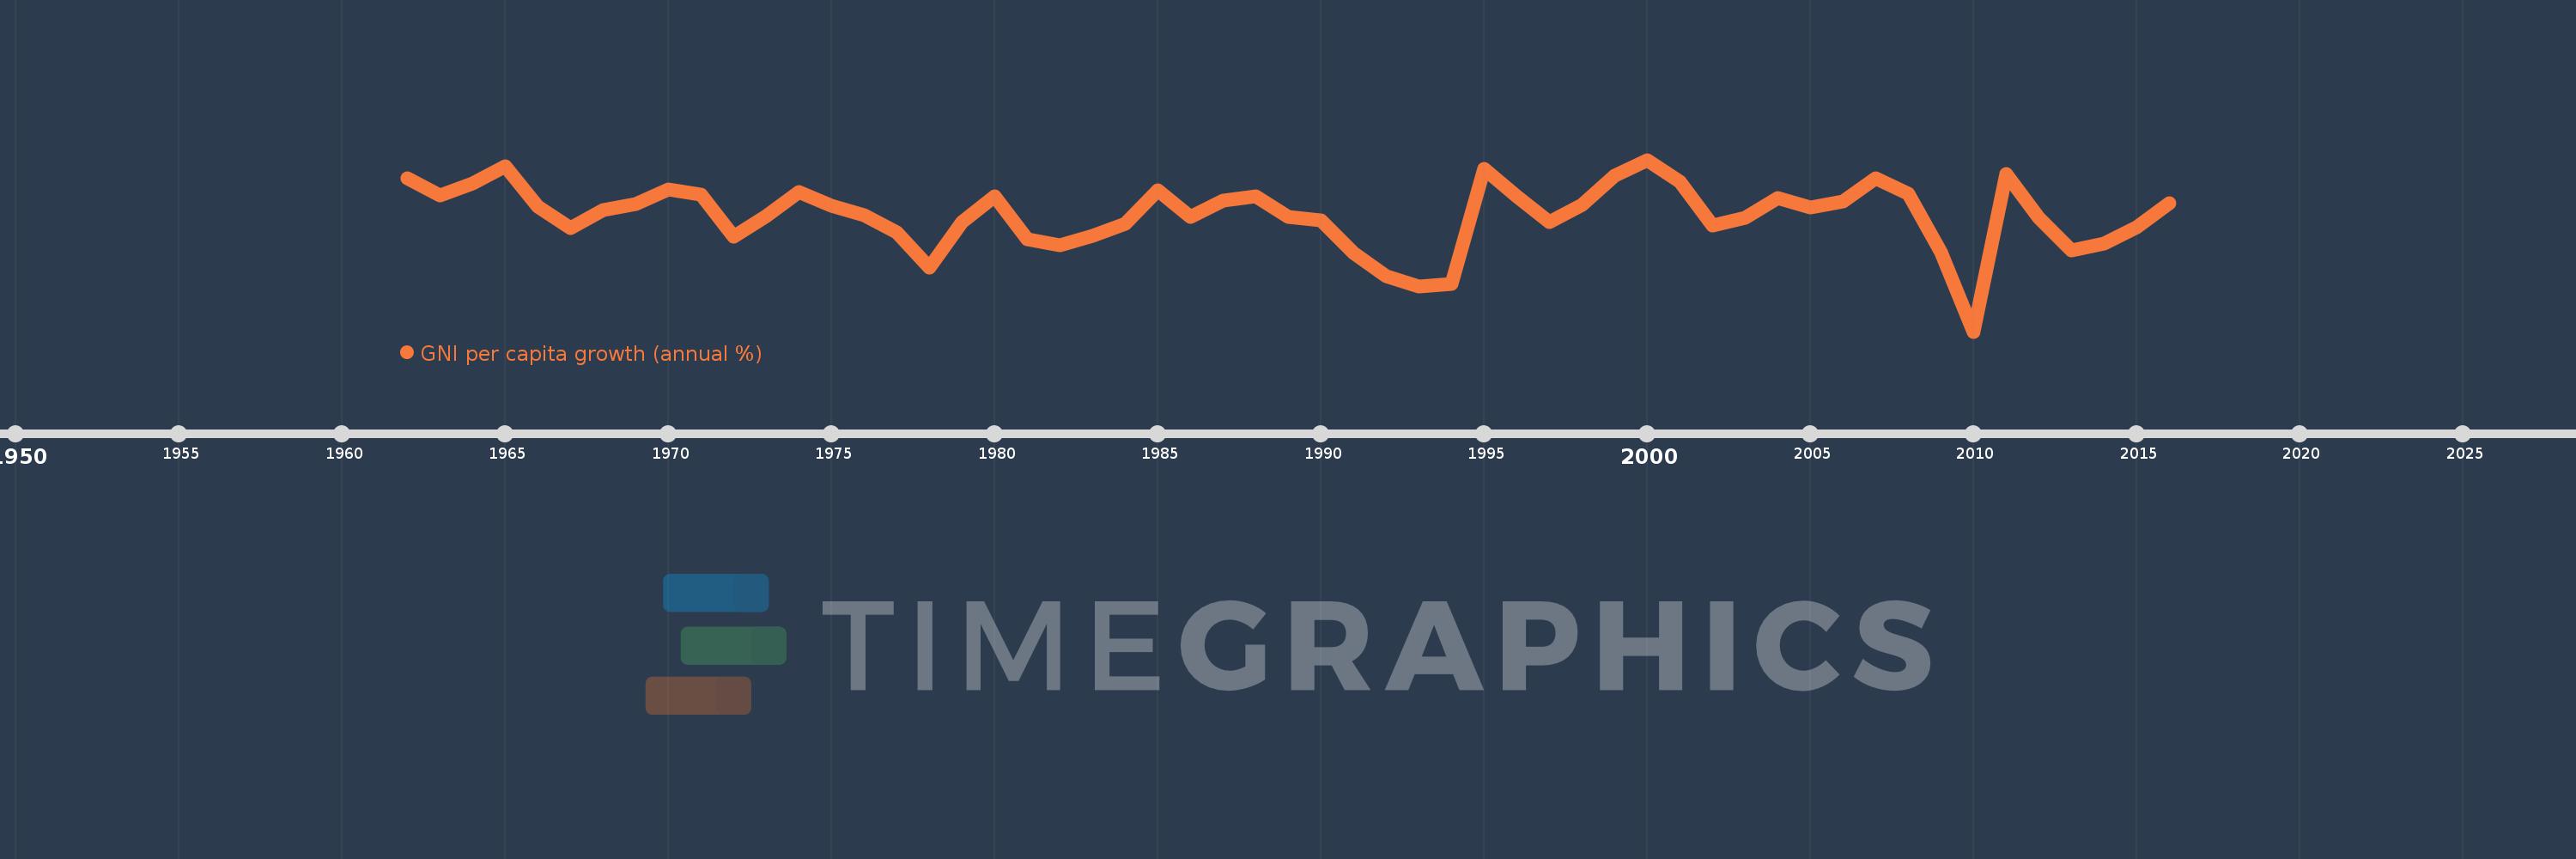
This timeline shows a graph from 1962 to 2016 of Sweden. No data until 1961. Number of actual observations by date: 55.
Source name:
World Development Indicators
Source organization:
World Bank national accounts data, and OECD National Accounts data files.
Categories, topics:
Economy & Growth
Last updated:
apr 23, 2017
Indicators value changes by year
At the date of observation
Value
Absolute change
Change from previous value
jan 1, 1962
5.148
+5.148
0.0%
jan 1, 1963
3.702
-1.446
-28.1%
jan 1, 1964
4.699
+0.997
26.94%
jan 1, 1965
6.104
+1.405
29.9%
jan 1, 1966
2.802
-3.302
-54.1%
jan 1, 1967
1.092
-1.71
-61.04%
jan 1, 1968
2.521
+1.429
130.95%
jan 1, 1969
3.02
+0.499
19.79%
jan 1, 1970
4.242
+1.223
40.48%
jan 1, 1971
3.8
-0.443
-10.44%
jan 1, 1972
0.398
-3.401
-89.51%
jan 1, 1973
2.075
+1.676
420.62%
jan 1, 1974
3.993
+1.918
92.47%
jan 1, 1975
2.881
-1.112
-27.84%
jan 1, 1976
2.134
-0.747
-25.92%
jan 1, 1977
0.703
-1.431
-67.07%
jan 1, 1978
-2.133
-2.836
-403.44%
jan 1, 1979
1.564
+3.697
-173.33%
jan 1, 1980
3.645
+2.081
133.08%
jan 1, 1981
0.159
-3.486
-95.63%
jan 1, 1982
-0.331
-0.491
-307.86%
jan 1, 1983
0.438
+0.77
-232.3%
jan 1, 1984
1.426
+0.988
225.46%
jan 1, 1985
4.18
+2.753
193.02%
jan 1, 1986
1.966
-2.214
-52.97%
jan 1, 1987
3.283
+1.317
67.0%
jan 1, 1988
3.676
+0.394
12.0%
jan 1, 1989
1.973
-1.704
-46.34%
jan 1, 1990
1.688
-0.285
-14.43%
jan 1, 1991
-0.924
-2.612
-154.74%
jan 1, 1992
-2.842
-1.918
207.54%
jan 1, 1993
-3.649
-0.807
28.4%
jan 1, 1994
-3.464
+0.185
-5.07%
jan 1, 1995
5.874
+9.338
-269.57%
jan 1, 1996
3.629
-2.244
-38.21%
jan 1, 1997
1.566
-2.064
-56.86%
jan 1, 1998
2.931
+1.366
87.23%
jan 1, 1999
5.35
+2.419
82.53%
jan 1, 2000
6.625
+1.275
23.82%
jan 1, 2001
4.813
-1.812
-27.35%
jan 1, 2002
1.311
-3.502
-72.76%
jan 1, 2003
1.932
+0.62
47.31%
jan 1, 2004
3.506
+1.574
81.51%
jan 1, 2005
2.743
-0.763
-21.76%
jan 1, 2006
3.218
+0.475
17.32%
jan 1, 2007
5.141
+1.923
59.75%
jan 1, 2008
3.843
-1.298
-25.24%
jan 1, 2009
-0.852
-4.695
-122.16%
jan 1, 2010
-7.33
-6.478
760.48%
jan 1, 2011
5.454
+12.784
-174.4%
jan 1, 2012
1.935
-3.518
-64.51%
jan 1, 2013
-0.766
-2.702
-139.6%
jan 1, 2014
-0.153
+0.614
-80.06%
jan 1, 2015
1.139
+1.292
-845.31%
jan 1, 2016
3.095
+1.956
171.78%
Ranking of countries by current statistics by years


Comments: