29
/
en
AIzaSyAYiBZKx7MnpbEhh9jyipgxe19OcubqV5w
April 1, 2024
110961
Congo, Rep.
COG
true
2
1
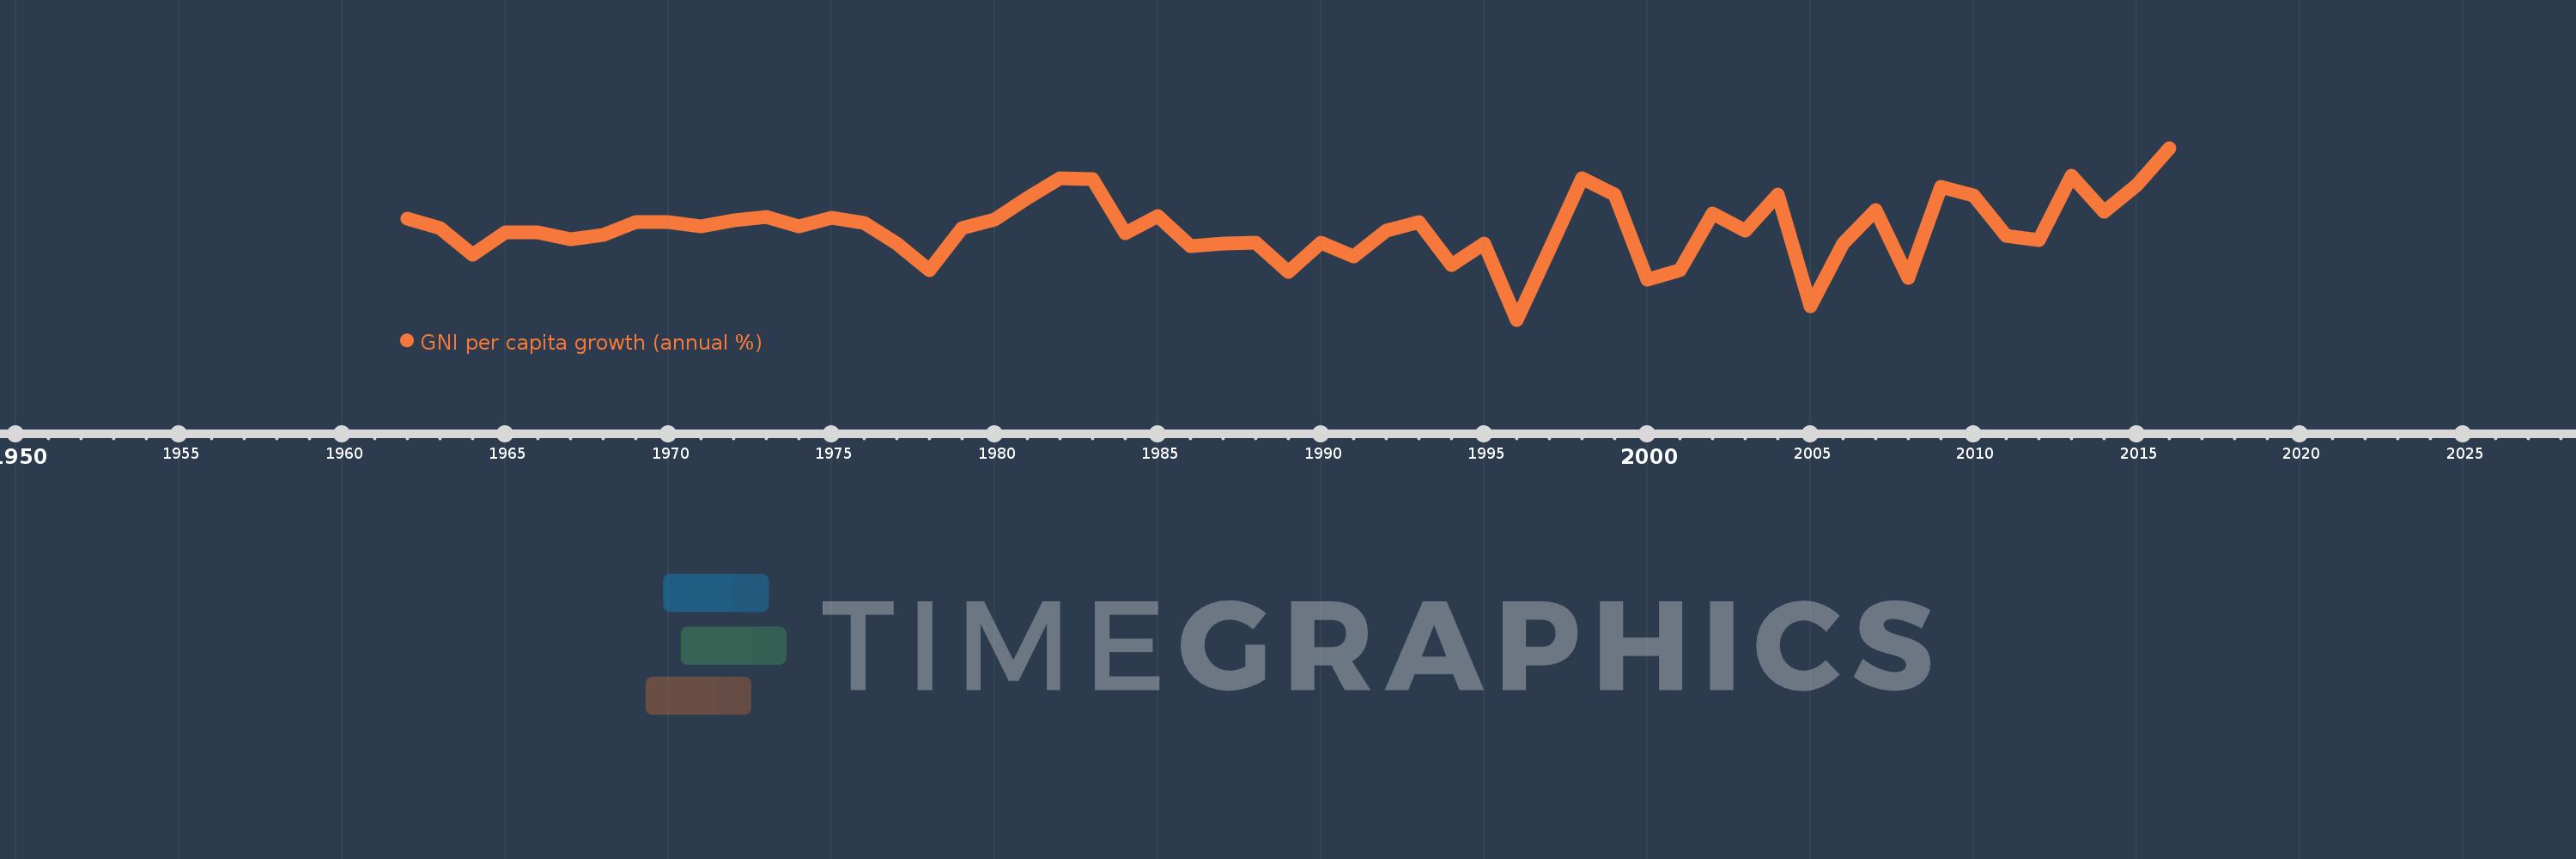
GNI per capita growth (annual %)
2016,2015,2014,2013,2012,2011,2010,2009,2008,2007,2006,2005,2004,2003,2002,2001,2000,1999,1998,1997,1996,1995,1994,1993,1992,1991,1990,1989,1988,1987,1986,1985,1984,1983,1982,1981,1980,1979,1978,1977,1976,1975,1974,1973,1972,1971,1970,1969,1968,1967,1966,1965,1964,1963,1962
This statistics in other country:
AlbaniaAlgeriaAngolaAntigua and BarbudaArab WorldArgentinaArmeniaAustraliaAustriaAzerbaijanBahamas, TheBahrainBangladeshBarbadosBelarusBelgiumBelizeBeninBhutanBoliviaBosnia and HerzegovinaBotswanaBrazilBrunei DarussalamBulgariaBurkina FasoBurundiCabo VerdeCambodiaCameroonCanadaCaribbean small statesCentral Europe and the BalticsChadChileChinaColombiaComorosCongo, Dem. Rep.Congo, Rep.Costa RicaCote d'IvoireCroatiaCubaCyprusCzech RepublicDenmarkDjiboutiDominican RepublicEarly-demographic dividendEast Asia & PacificEast Asia & Pacific (excluding high income)East Asia & Pacific (IDA & IBRD countries)EcuadorEgypt, Arab Rep.El SalvadorEquatorial GuineaEritreaEstoniaEthiopiaEuro areaEurope & Central AsiaEurope & Central Asia (excluding high income)Europe & Central Asia (IDA & IBRD countries)European UnionFijiFinlandFranceGabonGambia, TheGeorgiaGermanyGhanaGreeceGuatemalaGuineaGuinea-BissauHaitiHeavily indebted poor countries (HIPC)High incomeHondurasHong Kong SAR, ChinaHungaryIBRD onlyIcelandIDA & IBRD totalIDA blendIDA onlyIDA totalIndiaIndonesiaIran, Islamic Rep.IrelandIsraelItalyJamaicaJapanJordanKazakhstanKenyaKorea, Rep.KosovoKuwaitKyrgyz RepublicLao PDRLate-demographic dividendLatin America & Caribbean Latin America & Caribbean (excluding high income)Latin America & the Caribbean (IDA & IBRD countries)LatviaLeast developed countries: UN classificationLebanonLiberiaLibyaLithuaniaLow & middle incomeLow incomeLower middle incomeLuxembourgMacao SAR, ChinaMacedonia, FYRMadagascarMalawiMalaysiaMaliMaltaMauritaniaMauritiusMexicoMiddle East & North AfricaMiddle East & North Africa (excluding high income)Middle East & North Africa (IDA & IBRD countries)Middle incomeMoldovaMongoliaMontenegroMoroccoMozambiqueMyanmarNamibiaNepalNetherlandsNew ZealandNicaraguaNigerNigeriaNorth AmericaNorwayOECD membersOmanOther small statesPakistanPanamaPapua New GuineaParaguayPeruPhilippinesPolandPortugalPost-demographic dividendPre-demographic dividendPuerto RicoQatarRomaniaRussian FederationRwandaSamoaSaudi ArabiaSenegalSerbiaSeychellesSierra LeoneSingaporeSlovak RepublicSloveniaSmall statesSomaliaSouth AfricaSouth AsiaSouth Asia (IDA & IBRD)South SudanSpainSri LankaSub-Saharan Africa Sub-Saharan Africa (excluding high income)Sub-Saharan Africa (IDA & IBRD countries)SudanSurinameSwazilandSwedenSwitzerlandSyrian Arab RepublicTajikistanTanzaniaThailandTimor-LesteTogoTrinidad and TobagoTunisiaTurkeyTurkmenistanUgandaUkraineUnited Arab EmiratesUnited KingdomUnited StatesUpper middle incomeUruguayUzbekistanVanuatuVenezuela, RBVietnamWest Bank and GazaWorldZambiaZimbabwe Timeline:
This timeline shows a graph from 1962 to 2016 of Congo, Rep.. No data until 1961. Number of actual observations by date: 55.
Source name:
World Development Indicators
Source organization:
World Bank national accounts data, and OECD National Accounts data files.
Categories, topics:
Economy & Growth
Last updated:
apr 23, 2017
Indicators value changes by year
Minimum:
-27.604
jan 1, 1996
At the date of observation
Value
Absolute change
Change from previous value
jan 1, 1962
5.383
+5.383
0.0%
jan 1, 1963
2.367
-3.015
-56.02%
jan 1, 1964
-6.538
-8.906
-376.18%
jan 1, 1965
0.992
+7.53
-115.17%
jan 1, 1966
0.841
-0.151
-15.21%
jan 1, 1967
-1.305
-2.146
-255.12%
jan 1, 1968
-0.036
+1.269
-97.26%
jan 1, 1969
4.285
+4.321
-12.09K%
jan 1, 1970
4.101
-0.184
-4.3%
jan 1, 1971
2.799
-1.302
-31.74%
jan 1, 1972
4.787
+1.988
71.0%
jan 1, 1973
5.979
+1.192
24.9%
jan 1, 1974
2.685
-3.294
-55.1%
jan 1, 1975
5.513
+2.829
105.37%
jan 1, 1976
3.994
-1.519
-27.56%
jan 1, 1977
-2.882
-6.876
-172.16%
jan 1, 1978
-11.513
-8.631
299.47%
jan 1, 1979
2.375
+13.888
-120.63%
jan 1, 1980
4.948
+2.572
108.29%
jan 1, 1981
12.079
+7.131
144.13%
jan 1, 1982
18.486
+6.408
53.05%
jan 1, 1983
18.117
-0.369
-2.0%
jan 1, 1984
0.575
-17.542
-96.83%
jan 1, 1985
6.27
+5.695
990.87%
jan 1, 1986
-3.678
-9.948
-158.65%
jan 1, 1987
-2.692
+0.986
-26.8%
jan 1, 1988
-2.447
+0.245
-9.1%
jan 1, 1989
-12.089
-9.642
393.99%
jan 1, 1990
-2.491
+9.598
-79.39%
jan 1, 1991
-6.987
-4.496
180.48%
jan 1, 1992
1.533
+8.52
-121.94%
jan 1, 1993
4.222
+2.689
175.4%
jan 1, 1994
-9.856
-14.078
-333.42%
jan 1, 1995
-2.845
+7.011
-71.13%
jan 1, 1996
-27.604
-24.759
870.32%
jan 1, 1997
-4.724
+22.88
-82.89%
jan 1, 1998
18.587
+23.31
-493.47%
jan 1, 1999
13.095
-5.491
-29.54%
jan 1, 2000
-14.493
-27.589
-210.68%
jan 1, 2001
-11.591
+2.902
-20.02%
jan 1, 2002
7.011
+18.603
-160.49%
jan 1, 2003
1.417
-5.594
-79.79%
jan 1, 2004
13.173
+11.756
829.49%
jan 1, 2005
-23.155
-36.328
-275.78%
jan 1, 2006
-2.818
+20.337
-87.83%
jan 1, 2007
8.16
+10.978
-389.54%
jan 1, 2008
-13.922
-22.082
-270.62%
jan 1, 2009
15.821
+29.743
-213.64%
jan 1, 2010
12.838
-2.983
-18.86%
jan 1, 2011
-0.252
-13.09
-101.96%
jan 1, 2012
-1.751
-1.499
594.42%
jan 1, 2013
19.296
+21.047
-1.2K%
jan 1, 2014
7.678
-11.618
-60.21%
jan 1, 2015
16.27
+8.592
111.92%
jan 1, 2016
28.38
+12.11
74.43%
Ranking of countries by current statistics by years


Comments: