29
/
en
AIzaSyAYiBZKx7MnpbEhh9jyipgxe19OcubqV5w
April 1, 2024
239312
Sierra Leone
SLE
true
2
1
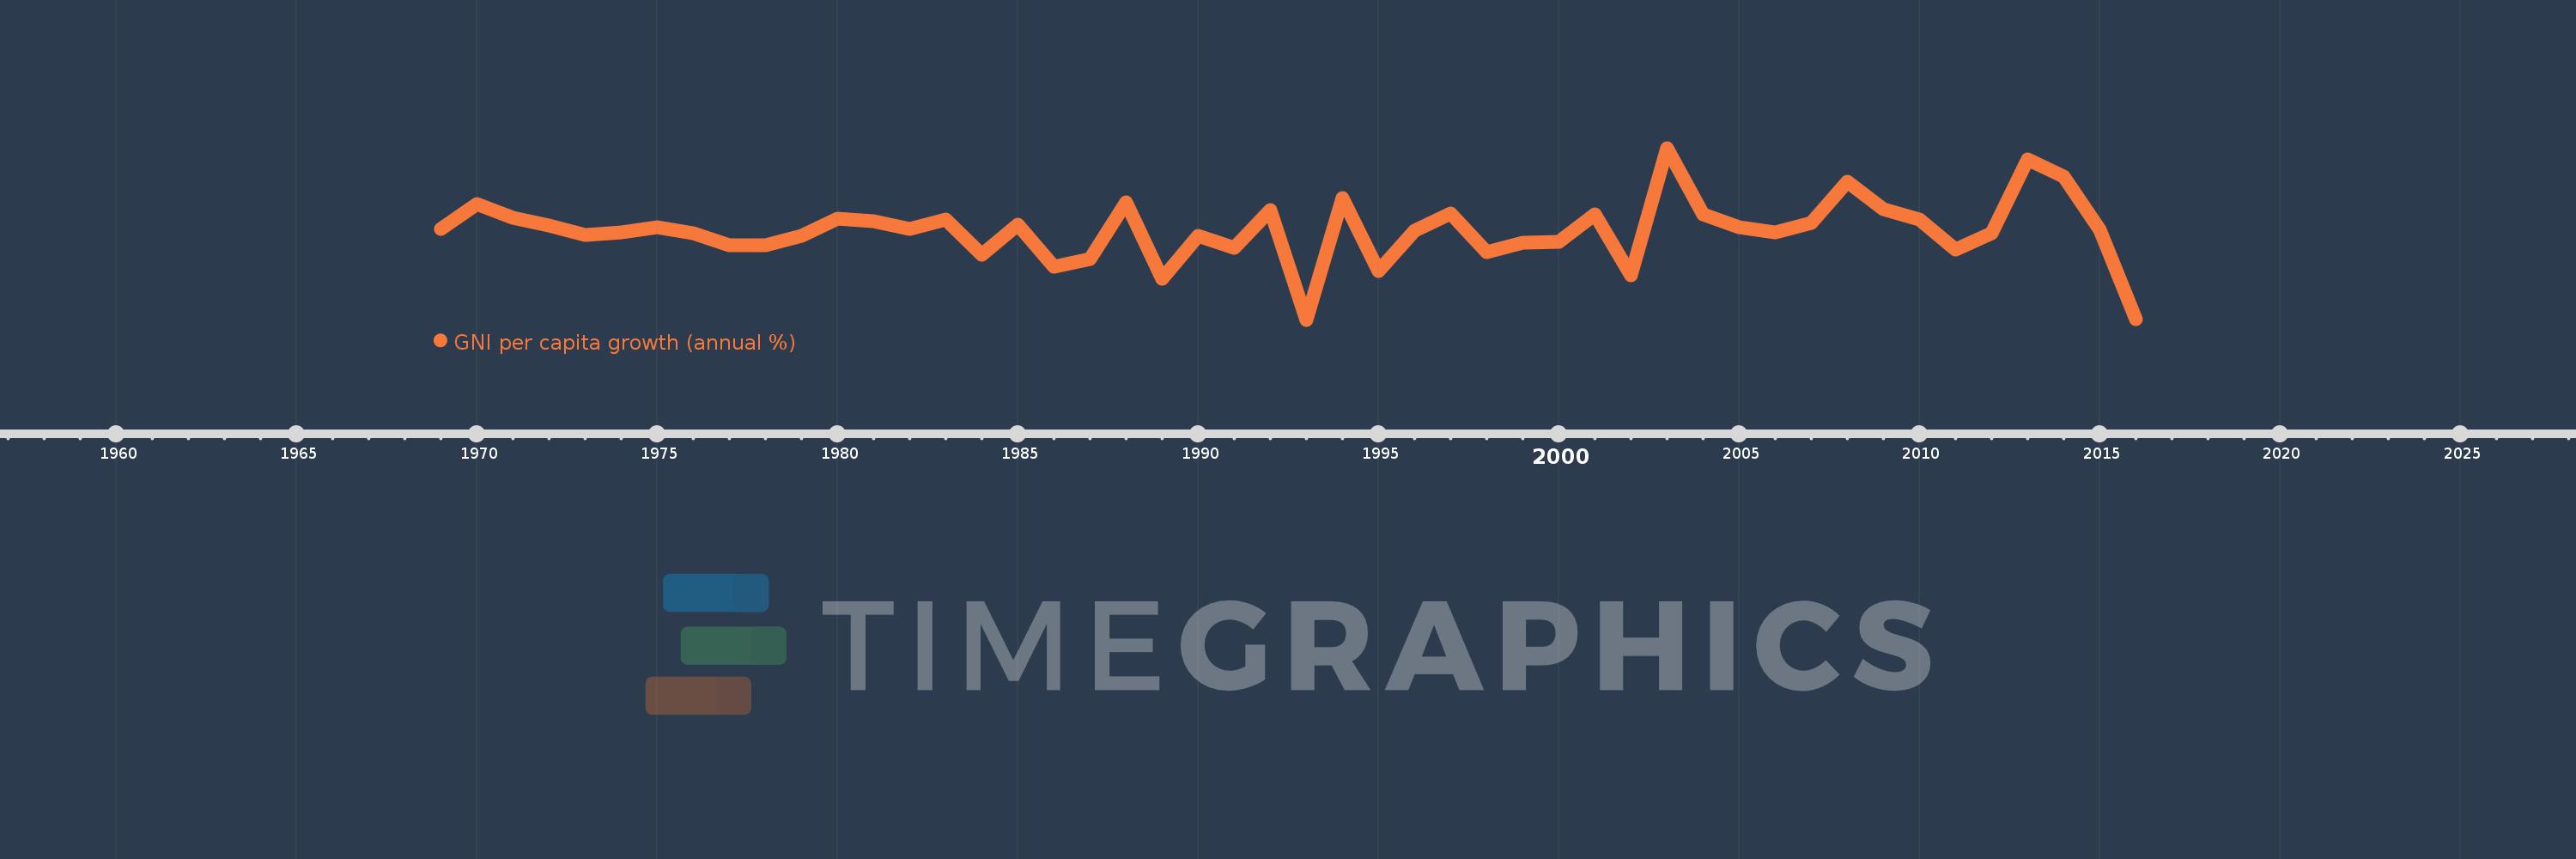
GNI per capita growth (annual %)
2016,2015,2014,2013,2012,2011,2010,2009,2008,2007,2006,2005,2004,2003,2002,2001,2000,1999,1998,1997,1996,1995,1994,1993,1992,1991,1990,1989,1988,1987,1986,1985,1984,1983,1982,1981,1980,1979,1978,1977,1976,1975,1974,1973,1972,1971,1970,1969
This statistics in other country:
AlbaniaAlgeriaAngolaAntigua and BarbudaArab WorldArgentinaArmeniaAustraliaAustriaAzerbaijanBahamas, TheBahrainBangladeshBarbadosBelarusBelgiumBelizeBeninBhutanBoliviaBosnia and HerzegovinaBotswanaBrazilBrunei DarussalamBulgariaBurkina FasoBurundiCabo VerdeCambodiaCameroonCanadaCaribbean small statesCentral Europe and the BalticsChadChileChinaColombiaComorosCongo, Dem. Rep.Congo, Rep.Costa RicaCote d'IvoireCroatiaCubaCyprusCzech RepublicDenmarkDjiboutiDominican RepublicEarly-demographic dividendEast Asia & PacificEast Asia & Pacific (excluding high income)East Asia & Pacific (IDA & IBRD countries)EcuadorEgypt, Arab Rep.El SalvadorEquatorial GuineaEritreaEstoniaEthiopiaEuro areaEurope & Central AsiaEurope & Central Asia (excluding high income)Europe & Central Asia (IDA & IBRD countries)European UnionFijiFinlandFranceGabonGambia, TheGeorgiaGermanyGhanaGreeceGuatemalaGuineaGuinea-BissauHaitiHeavily indebted poor countries (HIPC)High incomeHondurasHong Kong SAR, ChinaHungaryIBRD onlyIcelandIDA & IBRD totalIDA blendIDA onlyIDA totalIndiaIndonesiaIran, Islamic Rep.IrelandIsraelItalyJamaicaJapanJordanKazakhstanKenyaKorea, Rep.KosovoKuwaitKyrgyz RepublicLao PDRLate-demographic dividendLatin America & Caribbean Latin America & Caribbean (excluding high income)Latin America & the Caribbean (IDA & IBRD countries)LatviaLeast developed countries: UN classificationLebanonLiberiaLibyaLithuaniaLow & middle incomeLow incomeLower middle incomeLuxembourgMacao SAR, ChinaMacedonia, FYRMadagascarMalawiMalaysiaMaliMaltaMauritaniaMauritiusMexicoMiddle East & North AfricaMiddle East & North Africa (excluding high income)Middle East & North Africa (IDA & IBRD countries)Middle incomeMoldovaMongoliaMontenegroMoroccoMozambiqueMyanmarNamibiaNepalNetherlandsNew ZealandNicaraguaNigerNigeriaNorth AmericaNorwayOECD membersOmanOther small statesPakistanPanamaPapua New GuineaParaguayPeruPhilippinesPolandPortugalPost-demographic dividendPre-demographic dividendPuerto RicoQatarRomaniaRussian FederationRwandaSamoaSaudi ArabiaSenegalSerbiaSeychellesSierra LeoneSingaporeSlovak RepublicSloveniaSmall statesSomaliaSouth AfricaSouth AsiaSouth Asia (IDA & IBRD)South SudanSpainSri LankaSub-Saharan Africa Sub-Saharan Africa (excluding high income)Sub-Saharan Africa (IDA & IBRD countries)SudanSurinameSwazilandSwedenSwitzerlandSyrian Arab RepublicTajikistanTanzaniaThailandTimor-LesteTogoTrinidad and TobagoTunisiaTurkeyTurkmenistanUgandaUkraineUnited Arab EmiratesUnited KingdomUnited StatesUpper middle incomeUruguayUzbekistanVanuatuVenezuela, RBVietnamWest Bank and GazaWorldZambiaZimbabwe Timeline:
This timeline shows a graph from 1969 to 2016 of Sierra Leone. No data until 1968. Number of actual observations by date: 48.
Source name:
World Development Indicators
Source organization:
World Bank national accounts data, and OECD National Accounts data files.
Categories, topics:
Economy & Growth
Last updated:
apr 23, 2017
Indicators value changes by year
Minimum:
-21.256
jan 1, 1993
Maximum:
20.698
jan 1, 2003
At the date of observation
Value
Absolute change
Change from previous value
jan 1, 1969
0.835
+0.835
0.0%
jan 1, 1970
7.001
+6.166
738.58%
jan 1, 1971
3.703
-3.297
-47.1%
jan 1, 1972
1.723
-1.98
-53.48%
jan 1, 1973
-0.458
-2.181
-126.56%
jan 1, 1974
0.058
+0.516
-112.69%
jan 1, 1975
1.255
+1.197
2.06K%
jan 1, 1976
-0.067
-1.322
-105.3%
jan 1, 1977
-3.024
-2.958
4.44K%
jan 1, 1978
-3.136
-0.112
3.69%
jan 1, 1979
-0.683
+2.453
-78.21%
jan 1, 1980
3.525
+4.208
-616.01%
jan 1, 1981
2.761
-0.765
-21.69%
jan 1, 1982
0.938
-1.822
-66.01%
jan 1, 1983
3.158
+2.22
236.51%
jan 1, 1984
-5.425
-8.583
-271.77%
jan 1, 1985
1.919
+7.343
-135.37%
jan 1, 1986
-8.356
-10.274
-535.47%
jan 1, 1987
-6.343
+2.012
-24.08%
jan 1, 1988
7.336
+13.679
-215.65%
jan 1, 1989
-11.308
-18.644
-254.15%
jan 1, 1990
-0.719
+10.589
-93.64%
jan 1, 1991
-3.77
-3.052
424.62%
jan 1, 1992
5.467
+9.237
-245.0%
jan 1, 1993
-21.256
-26.723
-488.82%
jan 1, 1994
8.417
+29.673
-139.6%
jan 1, 1995
-9.344
-17.761
-211.02%
jan 1, 1996
0.5
+9.845
-105.35%
jan 1, 1997
4.719
+4.219
843.1%
jan 1, 1998
-4.813
-9.532
-201.99%
jan 1, 1999
-2.354
+2.46
-51.1%
jan 1, 2000
-2.133
+0.22
-9.36%
jan 1, 2001
4.565
+6.698
-313.97%
jan 1, 2002
-10.373
-14.937
-327.23%
jan 1, 2003
20.698
+31.07
-299.54%
jan 1, 2004
4.546
-16.152
-78.04%
jan 1, 2005
1.248
-3.298
-72.54%
jan 1, 2006
0.098
-1.151
-92.18%
jan 1, 2007
2.423
+2.326
2.38K%
jan 1, 2008
12.371
+9.947
410.47%
jan 1, 2009
5.667
-6.704
-54.19%
jan 1, 2010
3.235
-2.432
-42.92%
jan 1, 2011
-4.066
-7.301
-225.7%
jan 1, 2012
-0.114
+3.952
-97.19%
jan 1, 2013
18.012
+18.126
-15.87K%
jan 1, 2014
13.694
-4.318
-23.97%
jan 1, 2015
0.754
-12.939
-94.49%
jan 1, 2016
-21.124
-21.878
-2.9K%
Ranking of countries by current statistics by years


Comments: