29
/
en
AIzaSyAYiBZKx7MnpbEhh9jyipgxe19OcubqV5w
April 1, 2024
257331
Switzerland
CHE
true
2
1
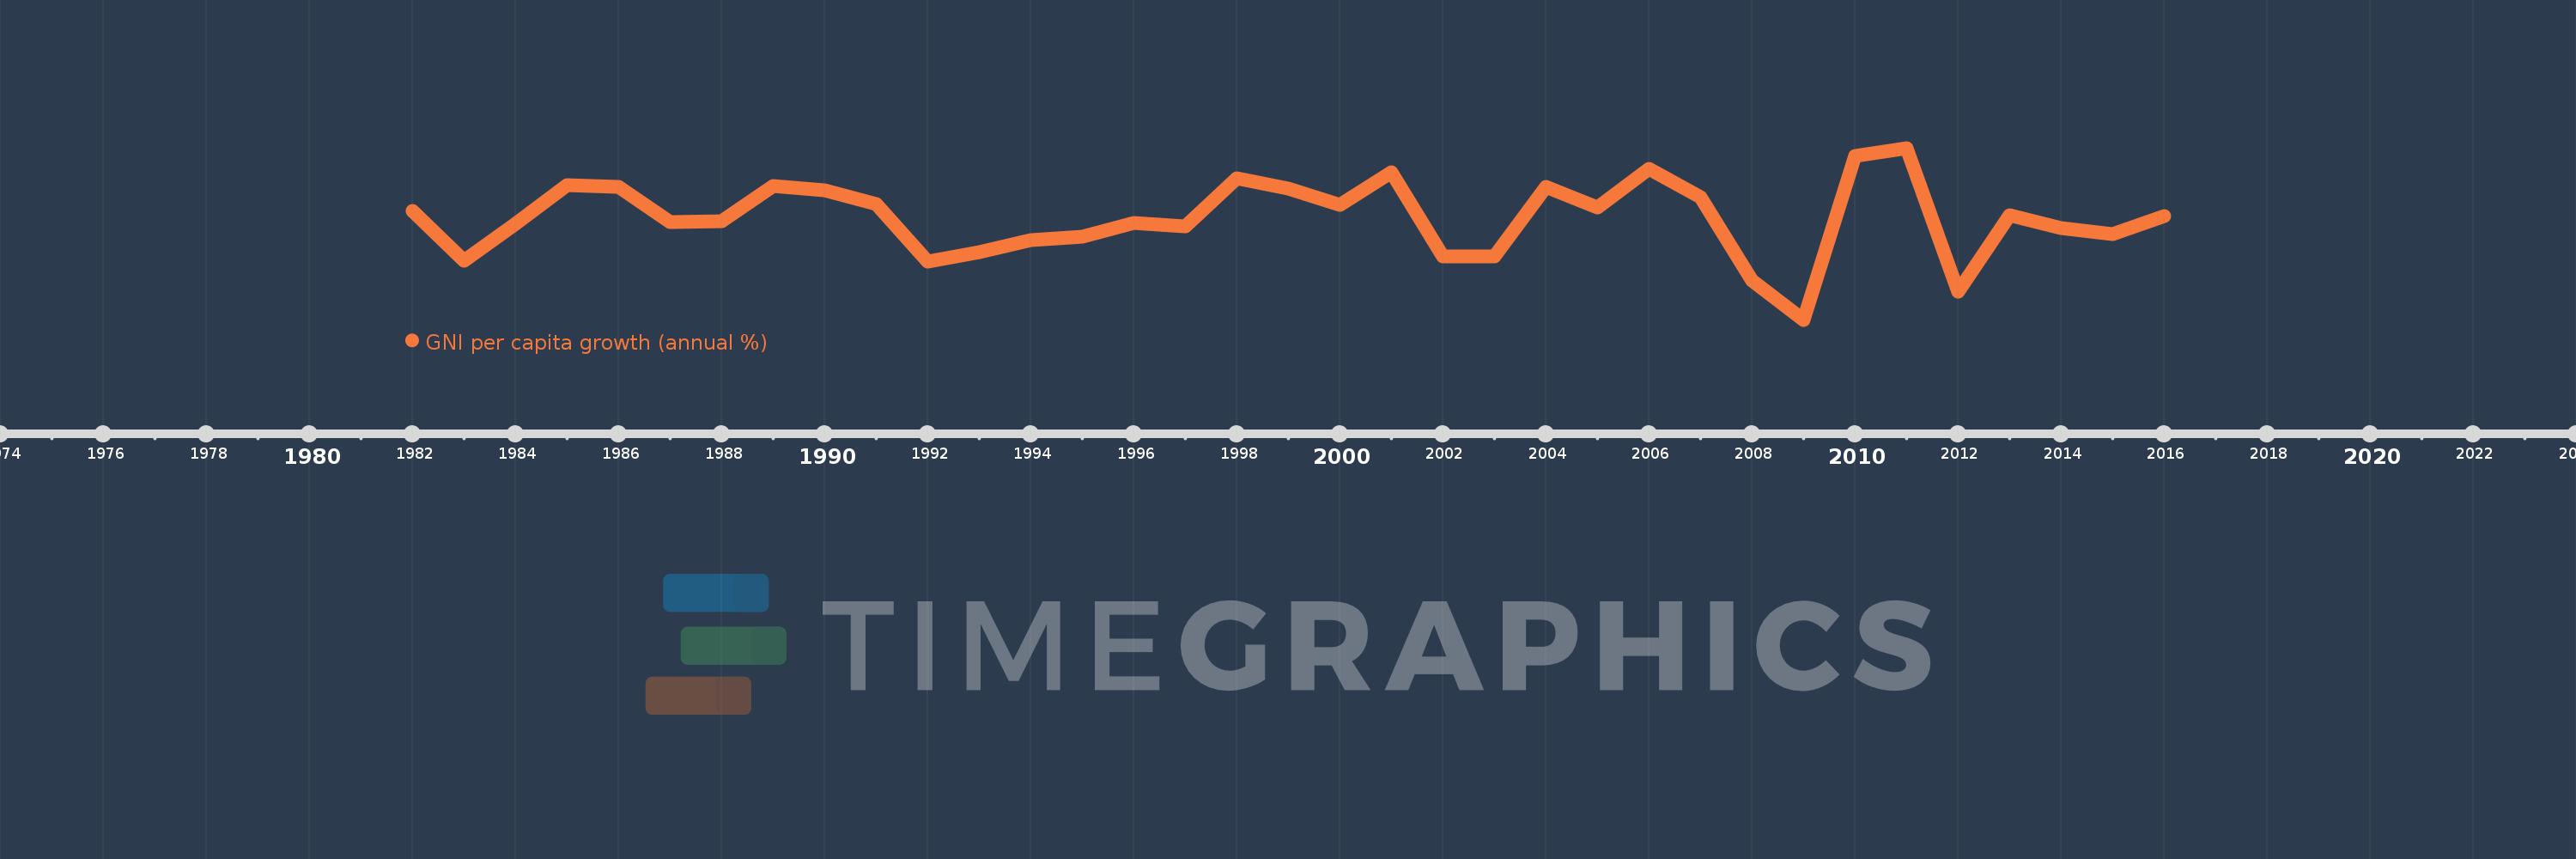
GNI per capita growth (annual %)
2016,2015,2014,2013,2012,2011,2010,2009,2008,2007,2006,2005,2004,2003,2002,2001,2000,1999,1998,1997,1996,1995,1994,1993,1992,1991,1990,1989,1988,1987,1986,1985,1984,1983,1982
This statistics in other country:
AlbaniaAlgeriaAngolaAntigua and BarbudaArab WorldArgentinaArmeniaAustraliaAustriaAzerbaijanBahamas, TheBahrainBangladeshBarbadosBelarusBelgiumBelizeBeninBhutanBoliviaBosnia and HerzegovinaBotswanaBrazilBrunei DarussalamBulgariaBurkina FasoBurundiCabo VerdeCambodiaCameroonCanadaCaribbean small statesCentral Europe and the BalticsChadChileChinaColombiaComorosCongo, Dem. Rep.Congo, Rep.Costa RicaCote d'IvoireCroatiaCubaCyprusCzech RepublicDenmarkDjiboutiDominican RepublicEarly-demographic dividendEast Asia & PacificEast Asia & Pacific (excluding high income)East Asia & Pacific (IDA & IBRD countries)EcuadorEgypt, Arab Rep.El SalvadorEquatorial GuineaEritreaEstoniaEthiopiaEuro areaEurope & Central AsiaEurope & Central Asia (excluding high income)Europe & Central Asia (IDA & IBRD countries)European UnionFijiFinlandFranceGabonGambia, TheGeorgiaGermanyGhanaGreeceGuatemalaGuineaGuinea-BissauHaitiHeavily indebted poor countries (HIPC)High incomeHondurasHong Kong SAR, ChinaHungaryIBRD onlyIcelandIDA & IBRD totalIDA blendIDA onlyIDA totalIndiaIndonesiaIran, Islamic Rep.IrelandIsraelItalyJamaicaJapanJordanKazakhstanKenyaKorea, Rep.KosovoKuwaitKyrgyz RepublicLao PDRLate-demographic dividendLatin America & Caribbean Latin America & Caribbean (excluding high income)Latin America & the Caribbean (IDA & IBRD countries)LatviaLeast developed countries: UN classificationLebanonLiberiaLibyaLithuaniaLow & middle incomeLow incomeLower middle incomeLuxembourgMacao SAR, ChinaMacedonia, FYRMadagascarMalawiMalaysiaMaliMaltaMauritaniaMauritiusMexicoMiddle East & North AfricaMiddle East & North Africa (excluding high income)Middle East & North Africa (IDA & IBRD countries)Middle incomeMoldovaMongoliaMontenegroMoroccoMozambiqueMyanmarNamibiaNepalNetherlandsNew ZealandNicaraguaNigerNigeriaNorth AmericaNorwayOECD membersOmanOther small statesPakistanPanamaPapua New GuineaParaguayPeruPhilippinesPolandPortugalPost-demographic dividendPre-demographic dividendPuerto RicoQatarRomaniaRussian FederationRwandaSamoaSaudi ArabiaSenegalSerbiaSeychellesSierra LeoneSingaporeSlovak RepublicSloveniaSmall statesSomaliaSouth AfricaSouth AsiaSouth Asia (IDA & IBRD)South SudanSpainSri LankaSub-Saharan Africa Sub-Saharan Africa (excluding high income)Sub-Saharan Africa (IDA & IBRD countries)SudanSurinameSwazilandSwedenSwitzerlandSyrian Arab RepublicTajikistanTanzaniaThailandTimor-LesteTogoTrinidad and TobagoTunisiaTurkeyTurkmenistanUgandaUkraineUnited Arab EmiratesUnited KingdomUnited StatesUpper middle incomeUruguayUzbekistanVanuatuVenezuela, RBVietnamWest Bank and GazaWorldZambiaZimbabwe Timeline:
This timeline shows a graph from 1982 to 2016 of Switzerland. No data until 1981. Number of actual observations by date: 35.
Source name:
World Development Indicators
Source organization:
World Bank national accounts data, and OECD National Accounts data files.
Categories, topics:
Economy & Growth
Last updated:
apr 23, 2017
Indicators value changes by year
Minimum:
-6.103
jan 1, 2009
At the date of observation
Value
Absolute change
Change from previous value
jan 1, 1982
1.512
+1.512
0.0%
jan 1, 1983
-1.993
-3.505
-231.78%
jan 1, 1984
0.567
+2.56
-128.47%
jan 1, 1985
3.312
+2.745
483.75%
jan 1, 1986
3.146
-0.166
-5.0%
jan 1, 1987
0.685
-2.462
-78.23%
jan 1, 1988
0.772
+0.087
12.73%
jan 1, 1989
3.237
+2.465
319.26%
jan 1, 1990
2.946
-0.291
-8.98%
jan 1, 1991
1.953
-0.993
-33.71%
jan 1, 1992
-2.048
-4.002
-204.86%
jan 1, 1993
-1.405
+0.643
-31.41%
jan 1, 1994
-0.579
+0.826
-58.76%
jan 1, 1995
-0.281
+0.298
-51.51%
jan 1, 1996
0.632
+0.913
-324.79%
jan 1, 1997
0.406
-0.225
-35.64%
jan 1, 1998
3.755
+3.349
823.88%
jan 1, 1999
3.053
-0.703
-18.71%
jan 1, 2000
1.909
-1.144
-37.47%
jan 1, 2001
4.21
+2.301
120.57%
jan 1, 2002
-1.708
-5.918
-140.56%
jan 1, 2003
-1.712
-0.004
0.26%
jan 1, 2004
3.169
+4.882
-285.11%
jan 1, 2005
1.748
-1.421
-44.85%
jan 1, 2006
4.453
+2.705
154.72%
jan 1, 2007
2.454
-1.999
-44.89%
jan 1, 2008
-3.359
-5.813
-236.88%
jan 1, 2009
-6.103
-2.745
81.71%
jan 1, 2010
5.31
+11.413
-187.0%
jan 1, 2011
5.879
+0.569
10.73%
jan 1, 2012
-4.151
-10.03
-170.6%
jan 1, 2013
1.209
+5.359
-129.12%
jan 1, 2014
0.269
-0.939
-77.72%
jan 1, 2015
-0.126
-0.395
-146.77%
jan 1, 2016
1.119
+1.245
-987.99%
Ranking of countries by current statistics by years


Comments: