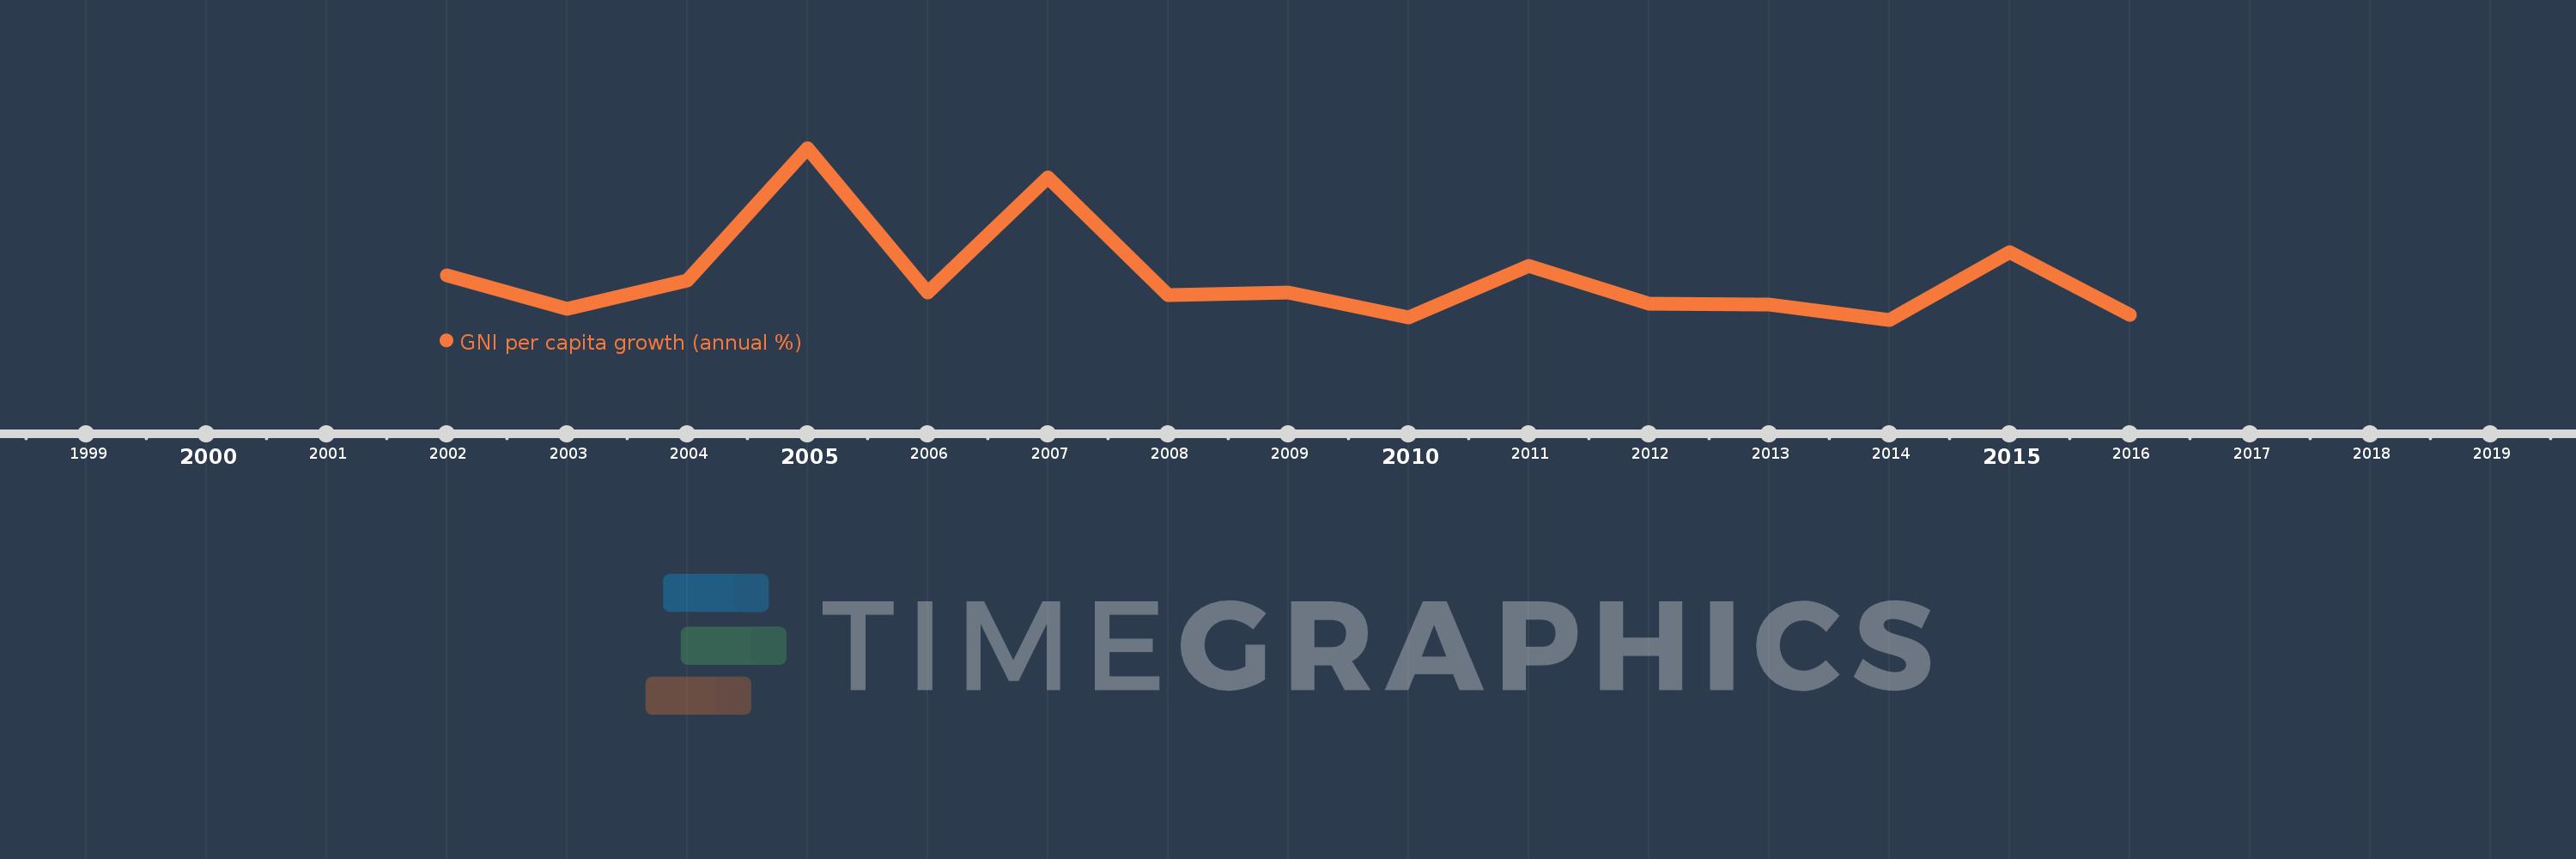
This timeline shows a graph from 2002 to 2016 of Sub-Saharan Africa (excluding high income). No data until 2001. Number of actual observations by date: 15.
Source name:
World Development Indicators
Source organization:
World Bank national accounts data, and OECD National Accounts data files.
Categories, topics:
Economy & Growth
Last updated:
apr 23, 2017
Indicators value changes by year
Meaning:
2.449
Minimum:
0.493
jan 1, 2014
Maximum:
8.29
jan 1, 2005
At the date of observation
Value
Absolute change
Change from the previous value
jan 1, 2002
2.502
+2.502
0.0%
jan 1, 2003
0.973
-1.529
-61.11%
jan 1, 2004
2.274
+1.301
133.69%
jan 1, 2005
8.29
+6.016
264.52%
jan 1, 2006
1.727
-6.563
-79.16%
jan 1, 2007
6.937
+5.21
301.63%
jan 1, 2008
1.609
-5.328
-76.81%
jan 1, 2009
1.712
+0.103
6.41%
jan 1, 2010
0.59
-1.122
-65.54%
jan 1, 2011
2.92
+2.33
394.94%
jan 1, 2012
1.23
-1.69
-57.87%
jan 1, 2013
1.187
-0.043
-3.5%
jan 1, 2014
0.493
-0.694
-58.45%
jan 1, 2015
3.58
+3.086
625.59%
jan 1, 2016
0.708
-2.871
-80.21%
Ranking of countries by current statistics by years
