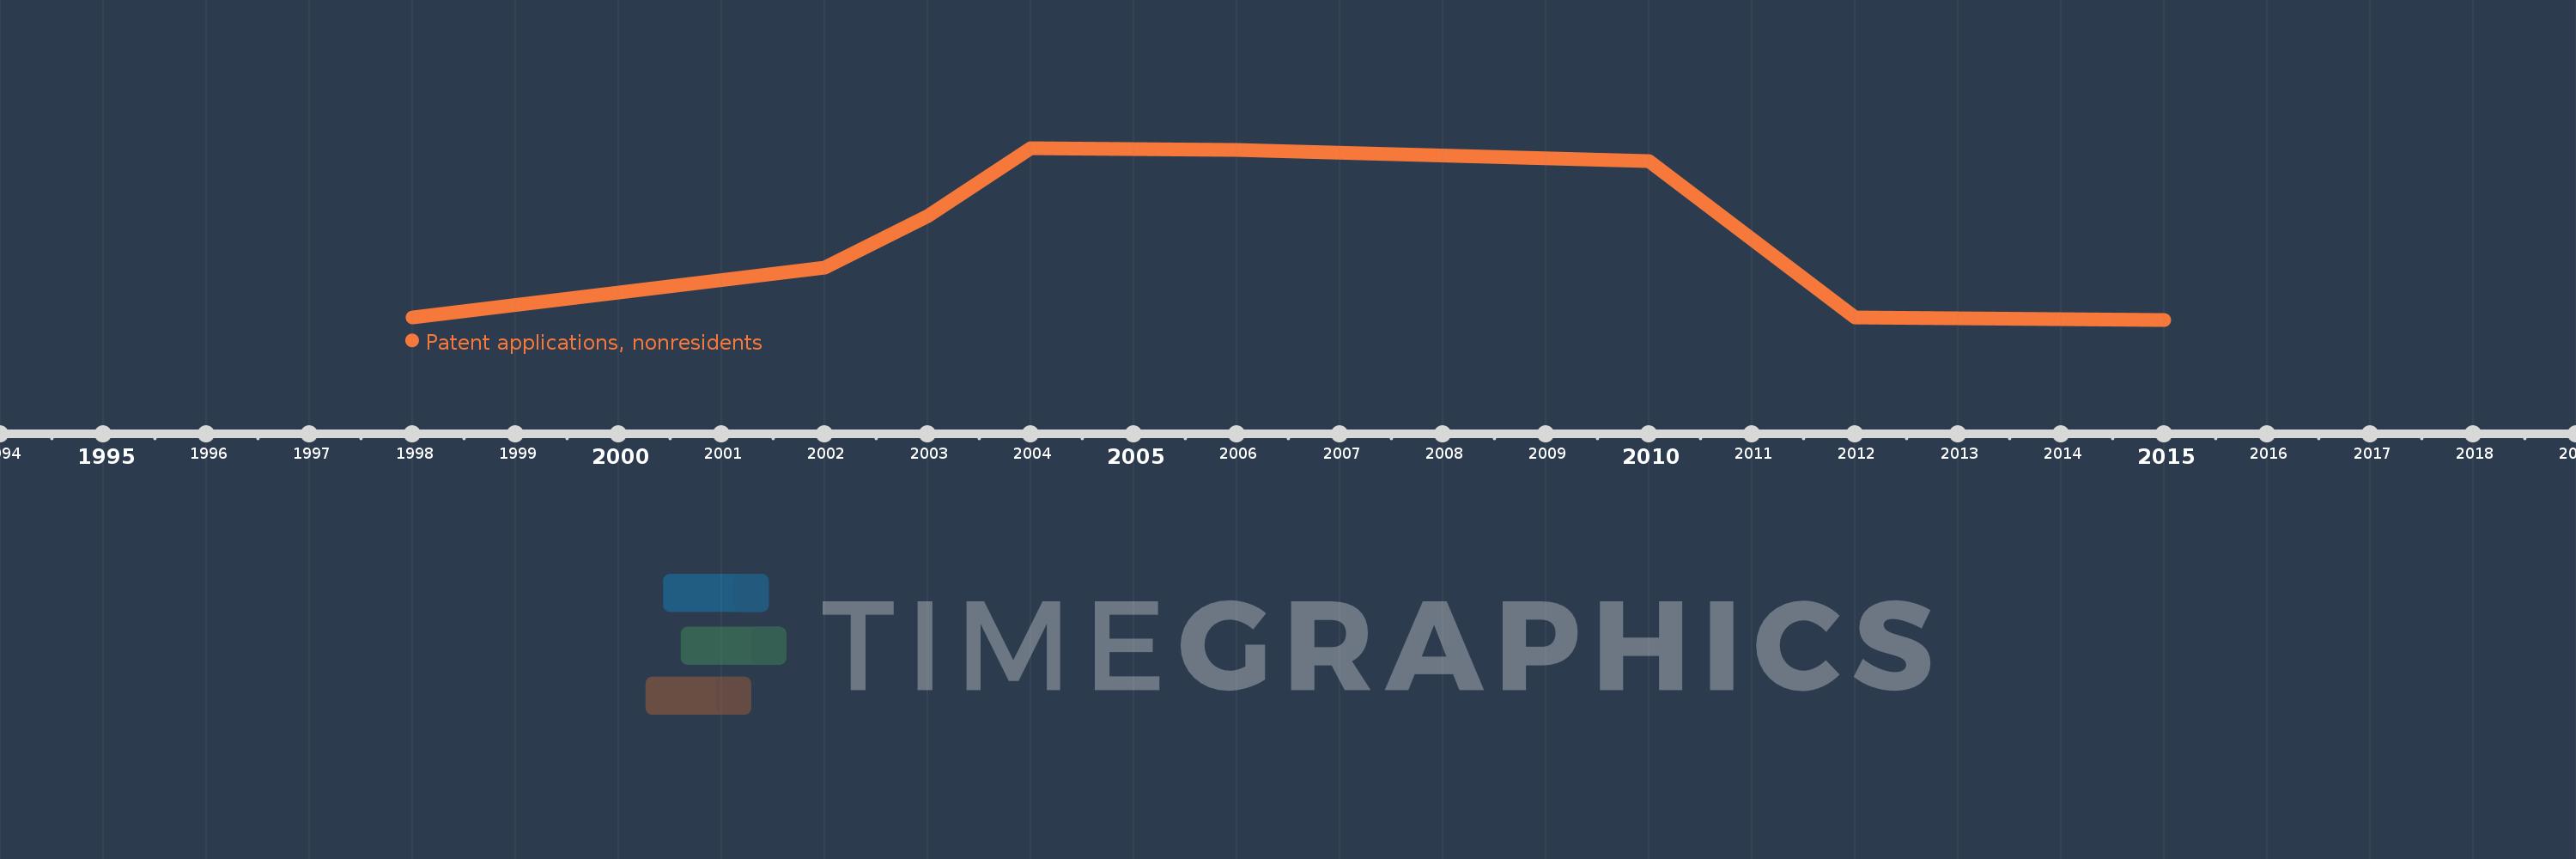
This timeline shows a graph from 1998 to 2015 of Albania. No data until 1997. Number of actual observations by date: 9.
Source name:
World Development Indicators
Source organization:
World Intellectual Property Organization (WIPO), WIPO Patent Report: Statistics on Worldwide Patent Activity. The International Bureau of WIPO assumes no responsibility with respect to the transformation of these data.
Categories, topics:
Science & Technology
Last updated:
apr 23, 2017
Indicators value changes by year
Meaning:
168.889
Minimum:
3.0
jan 1, 2015
Maximum:
391.0
jan 1, 2004
At the date of observation
Value
Absolute change
Change from the previous value
jan 1, 1998
9.0
+9.0
0.0%
jan 1, 2002
120.0
+111.0
1.23K%
jan 1, 2003
238.0
+118.0
98.33%
jan 1, 2004
391.0
+153.0
64.29%
jan 1, 2006
386.0
-5.0
-1.28%
jan 1, 2010
361.0
-25.0
-6.48%
jan 1, 2012
8.0
-353.0
-97.78%
jan 1, 2014
4.0
-4.0
-50.0%
jan 1, 2015
3.0
-1.0
-25.0%
Ranking of countries by current statistics by years
