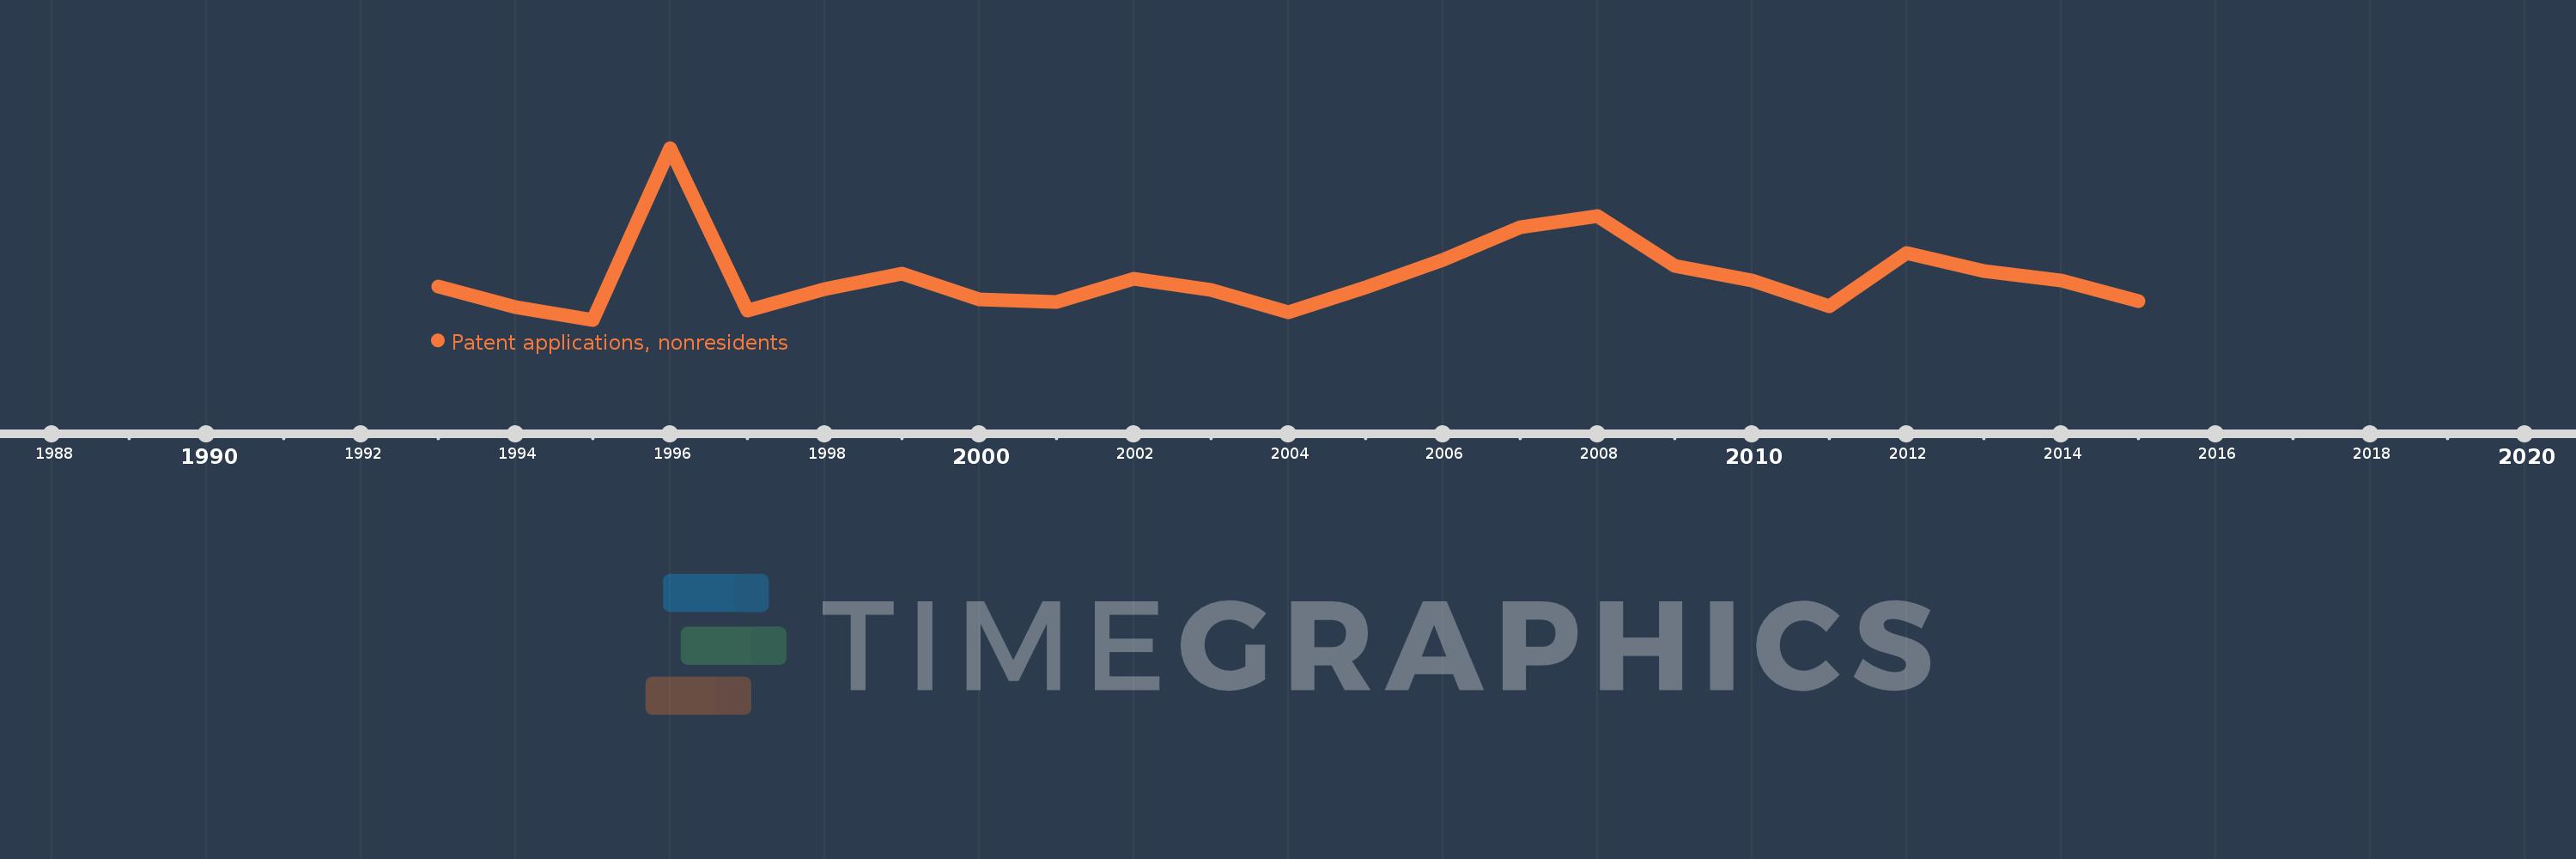
This timeline shows a graph from 1993 to 2015 of Georgia. No data until 1992. Number of actual observations by date: 23.
Source name:
World Development Indicators
Source organization:
World Intellectual Property Organization (WIPO), WIPO Patent Report: Statistics on Worldwide Patent Activity. The International Bureau of WIPO assumes no responsibility with respect to the transformation of these data.
Categories, topics:
Science & Technology
Last updated:
apr 23, 2017
Indicators value changes by year
Meaning:
224.174
Minimum:
159.0
jan 1, 1995
Maximum:
420.0
jan 1, 1996
At the date of observation
Value
Absolute change
Change from the previous value
jan 1, 1993
210.0
+210.0
0.0%
jan 1, 1994
178.0
-32.0
-15.24%
jan 1, 1995
159.0
-19.0
-10.67%
jan 1, 1996
420.0
+261.0
164.15%
jan 1, 1997
173.0
-247.0
-58.81%
jan 1, 1998
205.0
+32.0
18.5%
jan 1, 1999
229.0
+24.0
11.71%
jan 1, 2000
190.0
-39.0
-17.03%
jan 1, 2001
186.0
-4.0
-2.11%
jan 1, 2002
221.0
+35.0
18.82%
jan 1, 2003
204.0
-17.0
-7.69%
jan 1, 2004
171.0
-33.0
-16.18%
jan 1, 2005
208.0
+37.0
21.64%
jan 1, 2006
250.0
+42.0
20.19%
jan 1, 2007
299.0
+49.0
19.6%
jan 1, 2008
316.0
+17.0
5.69%
jan 1, 2009
241.0
-75.0
-23.73%
jan 1, 2010
218.0
-23.0
-9.54%
jan 1, 2011
179.0
-39.0
-17.89%
jan 1, 2012
260.0
+81.0
45.25%
jan 1, 2013
233.0
-27.0
-10.38%
jan 1, 2014
219.0
-14.0
-6.01%
jan 1, 2015
187.0
-32.0
-14.61%
Ranking of countries by current statistics by years
