29
/
en
AIzaSyAYiBZKx7MnpbEhh9jyipgxe19OcubqV5w
April 1, 2024
222660
Peru
PER
true
2
1
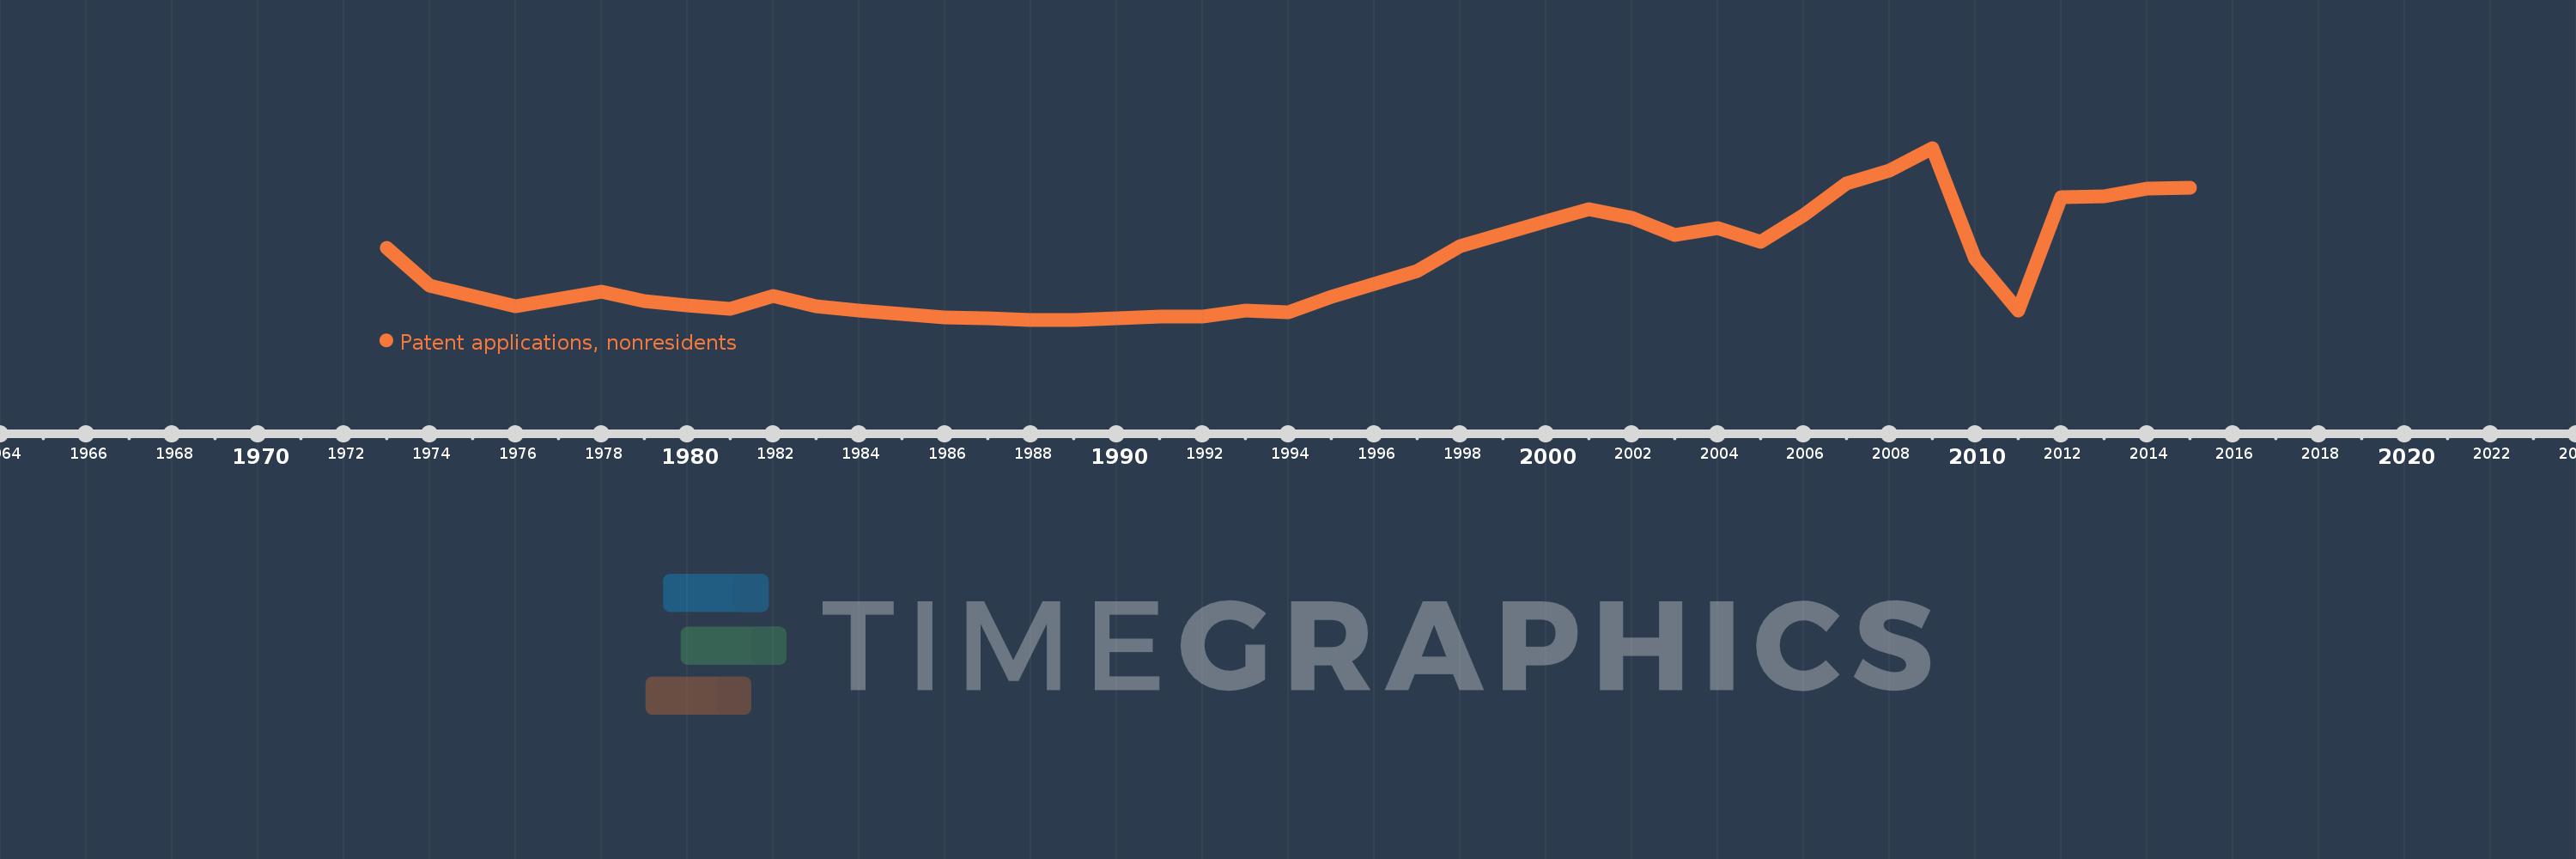
Patent applications, nonresidents
2015,2014,2013,2012,2011,2010,2009,2008,2007,2006,2005,2004,2003,2002,2001,2000,1998,1997,1995,1994,1993,1992,1991,1989,1988,1987,1986,1984,1983,1982,1981,1980,1979,1978,1976,1974,1973
This statistics in other country:
AlbaniaAlgeriaAngolaAntigua and BarbudaArab WorldArgentinaArmeniaAustraliaAustriaAzerbaijanBahamas, TheBahrainBangladeshBarbadosBelarusBelgiumBelizeBhutanBoliviaBosnia and HerzegovinaBotswanaBrazilBrunei DarussalamBulgariaBurundiCambodiaCanadaCaribbean small statesCentral Europe and the BalticsChileChinaColombiaCongo, Dem. Rep.Congo, Rep.Costa RicaCote d'IvoireCroatiaCubaCyprusCzech RepublicDenmarkDjiboutiDominicaDominican RepublicEarly-demographic dividendEast Asia & PacificEast Asia & Pacific (excluding high income)East Asia & Pacific (IDA & IBRD countries)EcuadorEgypt, Arab Rep.El SalvadorEstoniaEthiopiaEuro areaEurope & Central AsiaEurope & Central Asia (excluding high income)Europe & Central Asia (IDA & IBRD countries)European UnionFijiFinlandFranceGambia, TheGeorgiaGermanyGhanaGreeceGrenadaGuatemalaGuyanaHaitiHigh incomeHondurasHong Kong SAR, ChinaHungaryIBRD onlyIcelandIDA & IBRD totalIDA blendIndiaIndonesiaIran, Islamic Rep.IraqIrelandIsraelItalyJamaicaJapanJordanKazakhstanKenyaKiribatiKorea, Dem. People’s Rep.Korea, Rep.KuwaitKyrgyz RepublicLao PDRLate-demographic dividendLatin America & Caribbean Latin America & Caribbean (excluding high income)Latin America & the Caribbean (IDA & IBRD countries)LatviaLebanonLesothoLiberiaLibyaLithuaniaLow & middle incomeLower middle incomeLuxembourgMacao SAR, ChinaMacedonia, FYRMadagascarMalawiMalaysiaMaliMaltaMauritiusMexicoMiddle East & North AfricaMiddle East & North Africa (excluding high income)Middle East & North Africa (IDA & IBRD countries)Middle incomeMoldovaMonacoMongoliaMontenegroMoroccoMozambiqueNamibiaNepalNetherlandsNew ZealandNicaraguaNigeriaNorth AmericaNorwayOECD membersPacific island small statesPakistanPanamaPapua New GuineaParaguayPeruPhilippinesPolandPortugalPost-demographic dividendQatarRomaniaRussian FederationRwandaSamoaSao Tome and PrincipeSaudi ArabiaSerbiaSeychellesSierra LeoneSingaporeSlovak RepublicSloveniaSolomon IslandsSomaliaSouth AfricaSouth AsiaSouth Asia (IDA & IBRD)SpainSri LankaSt. LuciaSt. Vincent and the GrenadinesSudanSwazilandSwedenSwitzerlandSyrian Arab RepublicTajikistanTanzaniaThailandTrinidad and TobagoTunisiaTurkeyTurkmenistanUgandaUkraineUnited Arab EmiratesUnited KingdomUnited StatesUpper middle incomeUruguayUzbekistanVenezuela, RBVietnamWorldYemen, Rep.ZambiaZimbabwe Timeline:
This timeline shows a graph from 1973 to 2015 of Peru. No data until 1972. Number of actual observations by date: 37.
Source name:
World Development Indicators
Source organization:
World Intellectual Property Organization (WIPO), WIPO Patent Report: Statistics on Worldwide Patent Activity. The International Bureau of WIPO assumes no responsibility with respect to the transformation of these data.
Categories, topics:
Science & Technology
Last updated:
apr 23, 2017
Indicators value changes by year
Maximum:
1.504K
jan 1, 2009
At the date of observation
Value
Absolute change
Change from previous value
jan 1, 1973
740.0
+740.0
0.0%
jan 1, 1974
452.0
-288.0
-38.92%
jan 1, 1976
294.0
-158.0
-34.96%
jan 1, 1978
411.0
+117.0
39.8%
jan 1, 1979
333.0
-78.0
-18.98%
jan 1, 1980
306.0
-27.0
-8.11%
jan 1, 1981
280.0
-26.0
-8.5%
jan 1, 1982
375.0
+95.0
33.93%
jan 1, 1983
294.0
-81.0
-21.6%
jan 1, 1984
266.0
-28.0
-9.52%
jan 1, 1986
211.0
-55.0
-20.68%
jan 1, 1987
208.0
-3.0
-1.42%
jan 1, 1988
194.0
-14.0
-6.73%
jan 1, 1989
194.0
0.0
0.0%
jan 1, 1991
219.0
+25.0
12.89%
jan 1, 1992
216.0
-3.0
-1.37%
jan 1, 1993
262.0
+46.0
21.3%
jan 1, 1994
254.0
-8.0
-3.05%
jan 1, 1995
369.0
+115.0
45.28%
jan 1, 1997
565.0
+196.0
53.12%
jan 1, 1998
756.0
+191.0
33.81%
jan 1, 2000
944.0
+188.0
24.87%
jan 1, 2001
1.038K
+94.0
9.96%
jan 1, 2002
974.0
-64.0
-6.17%
jan 1, 2003
840.0
-134.0
-13.76%
jan 1, 2004
892.0
+52.0
6.19%
jan 1, 2005
785.0
-107.0
-12.0%
jan 1, 2006
993.0
+208.0
26.5%
jan 1, 2007
1.232K
+239.0
24.07%
jan 1, 2008
1.331K
+99.0
8.04%
jan 1, 2009
1.504K
+173.0
13.0%
jan 1, 2010
657.0
-847.0
-56.32%
jan 1, 2011
261.0
-396.0
-60.27%
jan 1, 2012
1.129K
+868.0
332.57%
jan 1, 2013
1.136K
+7.0
0.62%
jan 1, 2014
1.193K
+57.0
5.02%
jan 1, 2015
1.204K
+11.0
0.92%
Ranking of countries by current statistics by years


Comments: