29
/
en
AIzaSyAYiBZKx7MnpbEhh9jyipgxe19OcubqV5w
April 1, 2024
216896
Pakistan
PAK
true
2
1
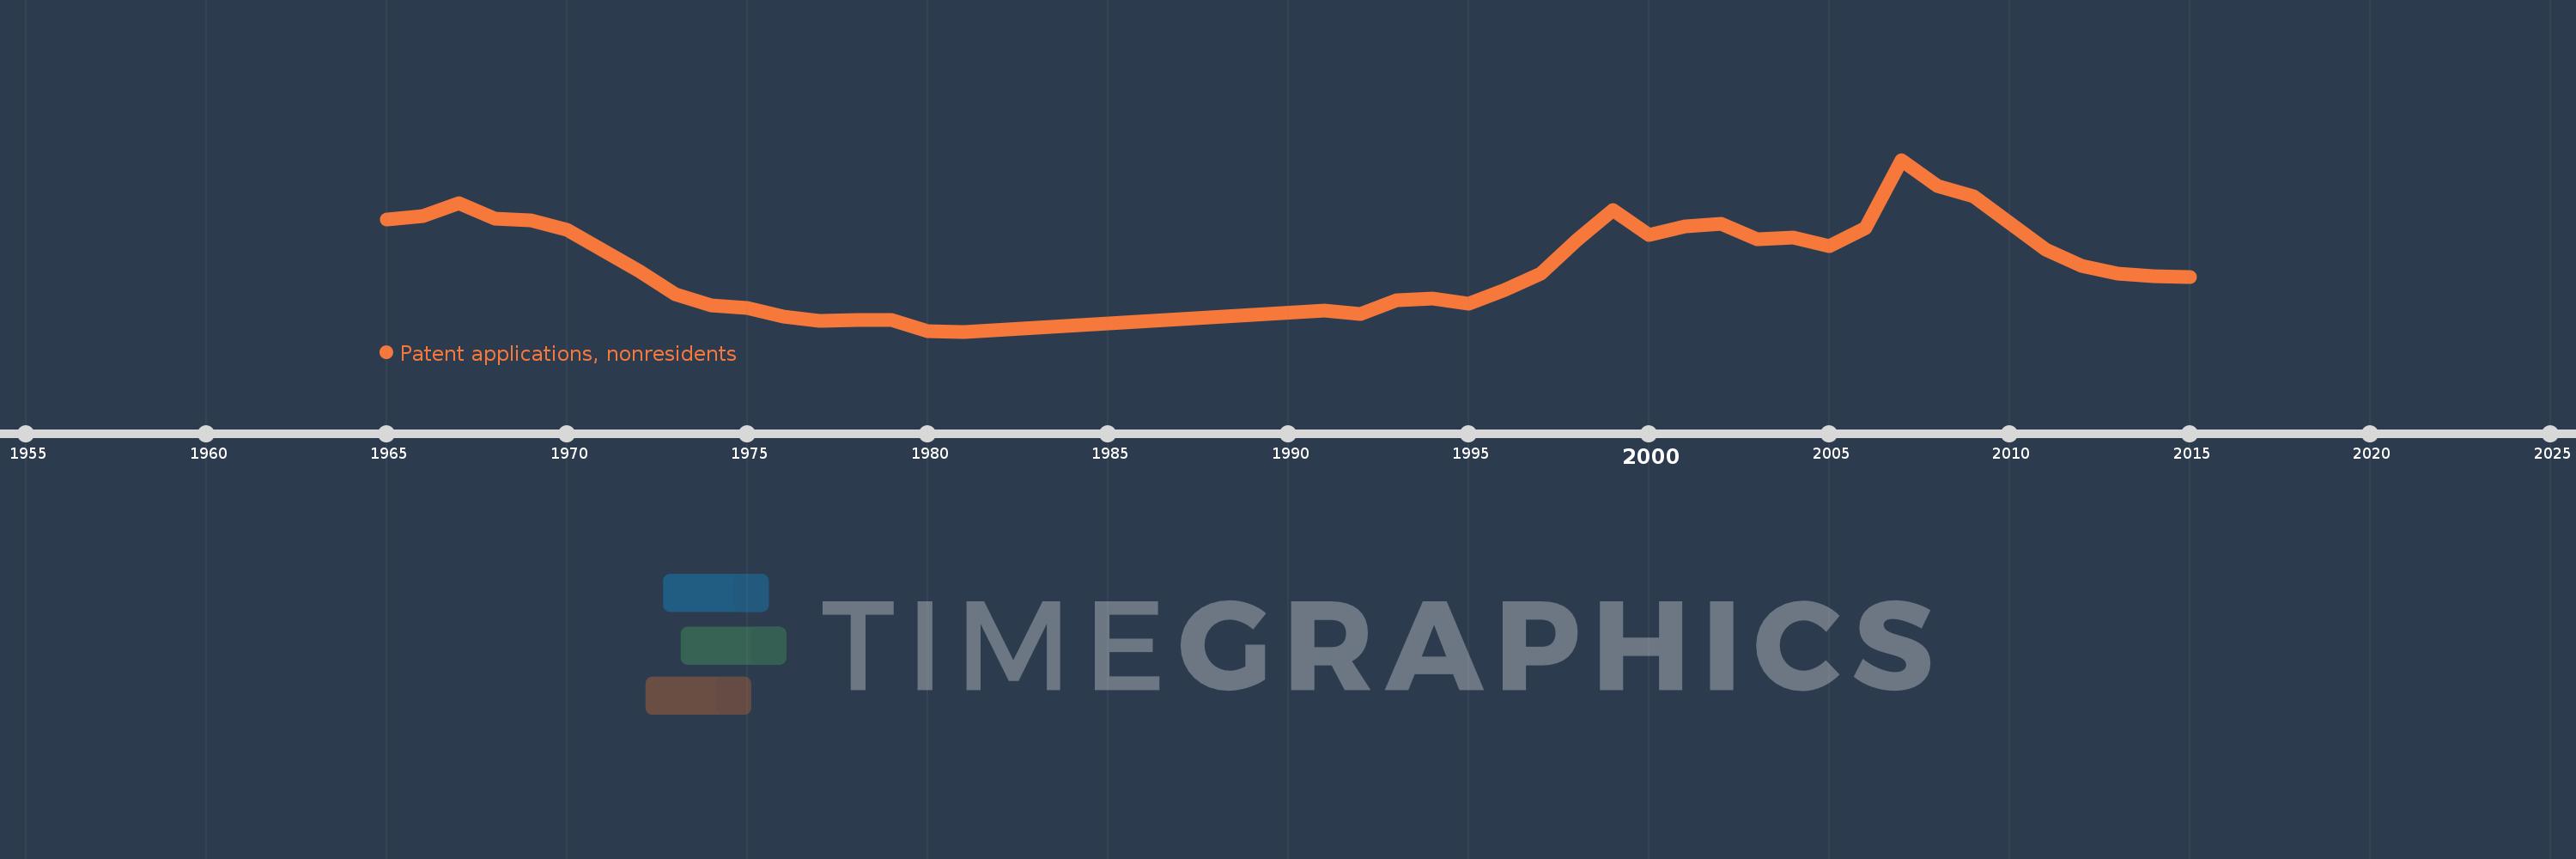
Patent applications, nonresidents
2015,2014,2013,2012,2011,2009,2008,2007,2006,2005,2004,2003,2002,2001,2000,1999,1998,1997,1996,1995,1994,1993,1992,1991,1981,1980,1979,1978,1977,1976,1975,1974,1973,1972,1970,1969,1968,1967,1966,1965
This statistics in other country:
AlbaniaAlgeriaAngolaAntigua and BarbudaArab WorldArgentinaArmeniaAustraliaAustriaAzerbaijanBahamas, TheBahrainBangladeshBarbadosBelarusBelgiumBelizeBhutanBoliviaBosnia and HerzegovinaBotswanaBrazilBrunei DarussalamBulgariaBurundiCambodiaCanadaCaribbean small statesCentral Europe and the BalticsChileChinaColombiaCongo, Dem. Rep.Congo, Rep.Costa RicaCote d'IvoireCroatiaCubaCyprusCzech RepublicDenmarkDjiboutiDominicaDominican RepublicEarly-demographic dividendEast Asia & PacificEast Asia & Pacific (excluding high income)East Asia & Pacific (IDA & IBRD countries)EcuadorEgypt, Arab Rep.El SalvadorEstoniaEthiopiaEuro areaEurope & Central AsiaEurope & Central Asia (excluding high income)Europe & Central Asia (IDA & IBRD countries)European UnionFijiFinlandFranceGambia, TheGeorgiaGermanyGhanaGreeceGrenadaGuatemalaGuyanaHaitiHigh incomeHondurasHong Kong SAR, ChinaHungaryIBRD onlyIcelandIDA & IBRD totalIDA blendIndiaIndonesiaIran, Islamic Rep.IraqIrelandIsraelItalyJamaicaJapanJordanKazakhstanKenyaKiribatiKorea, Dem. People’s Rep.Korea, Rep.KuwaitKyrgyz RepublicLao PDRLate-demographic dividendLatin America & Caribbean Latin America & Caribbean (excluding high income)Latin America & the Caribbean (IDA & IBRD countries)LatviaLebanonLesothoLiberiaLibyaLithuaniaLow & middle incomeLower middle incomeLuxembourgMacao SAR, ChinaMacedonia, FYRMadagascarMalawiMalaysiaMaliMaltaMauritiusMexicoMiddle East & North AfricaMiddle East & North Africa (excluding high income)Middle East & North Africa (IDA & IBRD countries)Middle incomeMoldovaMonacoMongoliaMontenegroMoroccoMozambiqueNamibiaNepalNetherlandsNew ZealandNicaraguaNigeriaNorth AmericaNorwayOECD membersPacific island small statesPakistanPanamaPapua New GuineaParaguayPeruPhilippinesPolandPortugalPost-demographic dividendQatarRomaniaRussian FederationRwandaSamoaSao Tome and PrincipeSaudi ArabiaSerbiaSeychellesSierra LeoneSingaporeSlovak RepublicSloveniaSolomon IslandsSomaliaSouth AfricaSouth AsiaSouth Asia (IDA & IBRD)SpainSri LankaSt. LuciaSt. Vincent and the GrenadinesSudanSwazilandSwedenSwitzerlandSyrian Arab RepublicTajikistanTanzaniaThailandTrinidad and TobagoTunisiaTurkeyTurkmenistanUgandaUkraineUnited Arab EmiratesUnited KingdomUnited StatesUpper middle incomeUruguayUzbekistanVenezuela, RBVietnamWorldYemen, Rep.ZambiaZimbabwe Timeline:
This timeline shows a graph from 1965 to 2015 of Pakistan. No data until 1964. Number of actual observations by date: 40.
Source name:
World Development Indicators
Source organization:
World Intellectual Property Organization (WIPO), WIPO Patent Report: Statistics on Worldwide Patent Activity. The International Bureau of WIPO assumes no responsibility with respect to the transformation of these data.
Categories, topics:
Science & Technology
Last updated:
apr 23, 2017
Indicators value changes by year
Maximum:
1.647K
jan 1, 2007
At the date of observation
Value
Absolute change
Change from previous value
jan 1, 1965
1.204K
+1.204K
0.0%
jan 1, 1966
1.231K
+27.0
2.24%
jan 1, 1967
1.323K
+92.0
7.47%
jan 1, 1968
1.209K
-114.0
-8.62%
jan 1, 1969
1.196K
-13.0
-1.08%
jan 1, 1970
1.129K
-67.0
-5.6%
jan 1, 1972
818.0
-311.0
-27.55%
jan 1, 1973
646.0
-172.0
-21.03%
jan 1, 1974
565.0
-81.0
-12.54%
jan 1, 1975
542.0
-23.0
-4.07%
jan 1, 1976
482.0
-60.0
-11.07%
jan 1, 1977
450.0
-32.0
-6.64%
jan 1, 1978
454.0
+4.0
0.89%
jan 1, 1979
456.0
+2.0
0.44%
jan 1, 1980
375.0
-81.0
-17.76%
jan 1, 1981
369.0
-6.0
-1.6%
jan 1, 1991
524.0
+155.0
42.01%
jan 1, 1992
502.0
-22.0
-4.2%
jan 1, 1993
605.0
+103.0
20.52%
jan 1, 1994
617.0
+12.0
1.98%
jan 1, 1995
574.0
-43.0
-6.97%
jan 1, 1996
678.0
+104.0
18.12%
jan 1, 1997
799.0
+121.0
17.85%
jan 1, 1998
1.049K
+250.0
31.29%
jan 1, 1999
1.275K
+226.0
21.54%
jan 1, 2000
1.089K
-186.0
-14.59%
jan 1, 2001
1.149K
+60.0
5.51%
jan 1, 2002
1.168K
+19.0
1.65%
jan 1, 2003
1.057K
-111.0
-9.5%
jan 1, 2004
1.07K
+13.0
1.23%
jan 1, 2005
1.008K
-62.0
-5.79%
jan 1, 2006
1.141K
+133.0
13.19%
jan 1, 2007
1.647K
+506.0
44.35%
jan 1, 2008
1.449K
-198.0
-12.02%
jan 1, 2009
1.375K
-74.0
-5.11%
jan 1, 2011
980.0
-395.0
-28.73%
jan 1, 2012
861.0
-119.0
-12.14%
jan 1, 2013
798.0
-63.0
-7.32%
jan 1, 2014
783.0
-15.0
-1.88%
jan 1, 2015
776.0
-7.0
-0.89%
Ranking of countries by current statistics by years


Comments: