29
/
en
AIzaSyAYiBZKx7MnpbEhh9jyipgxe19OcubqV5w
April 1, 2024
161834
Italy
ITA
true
2
1
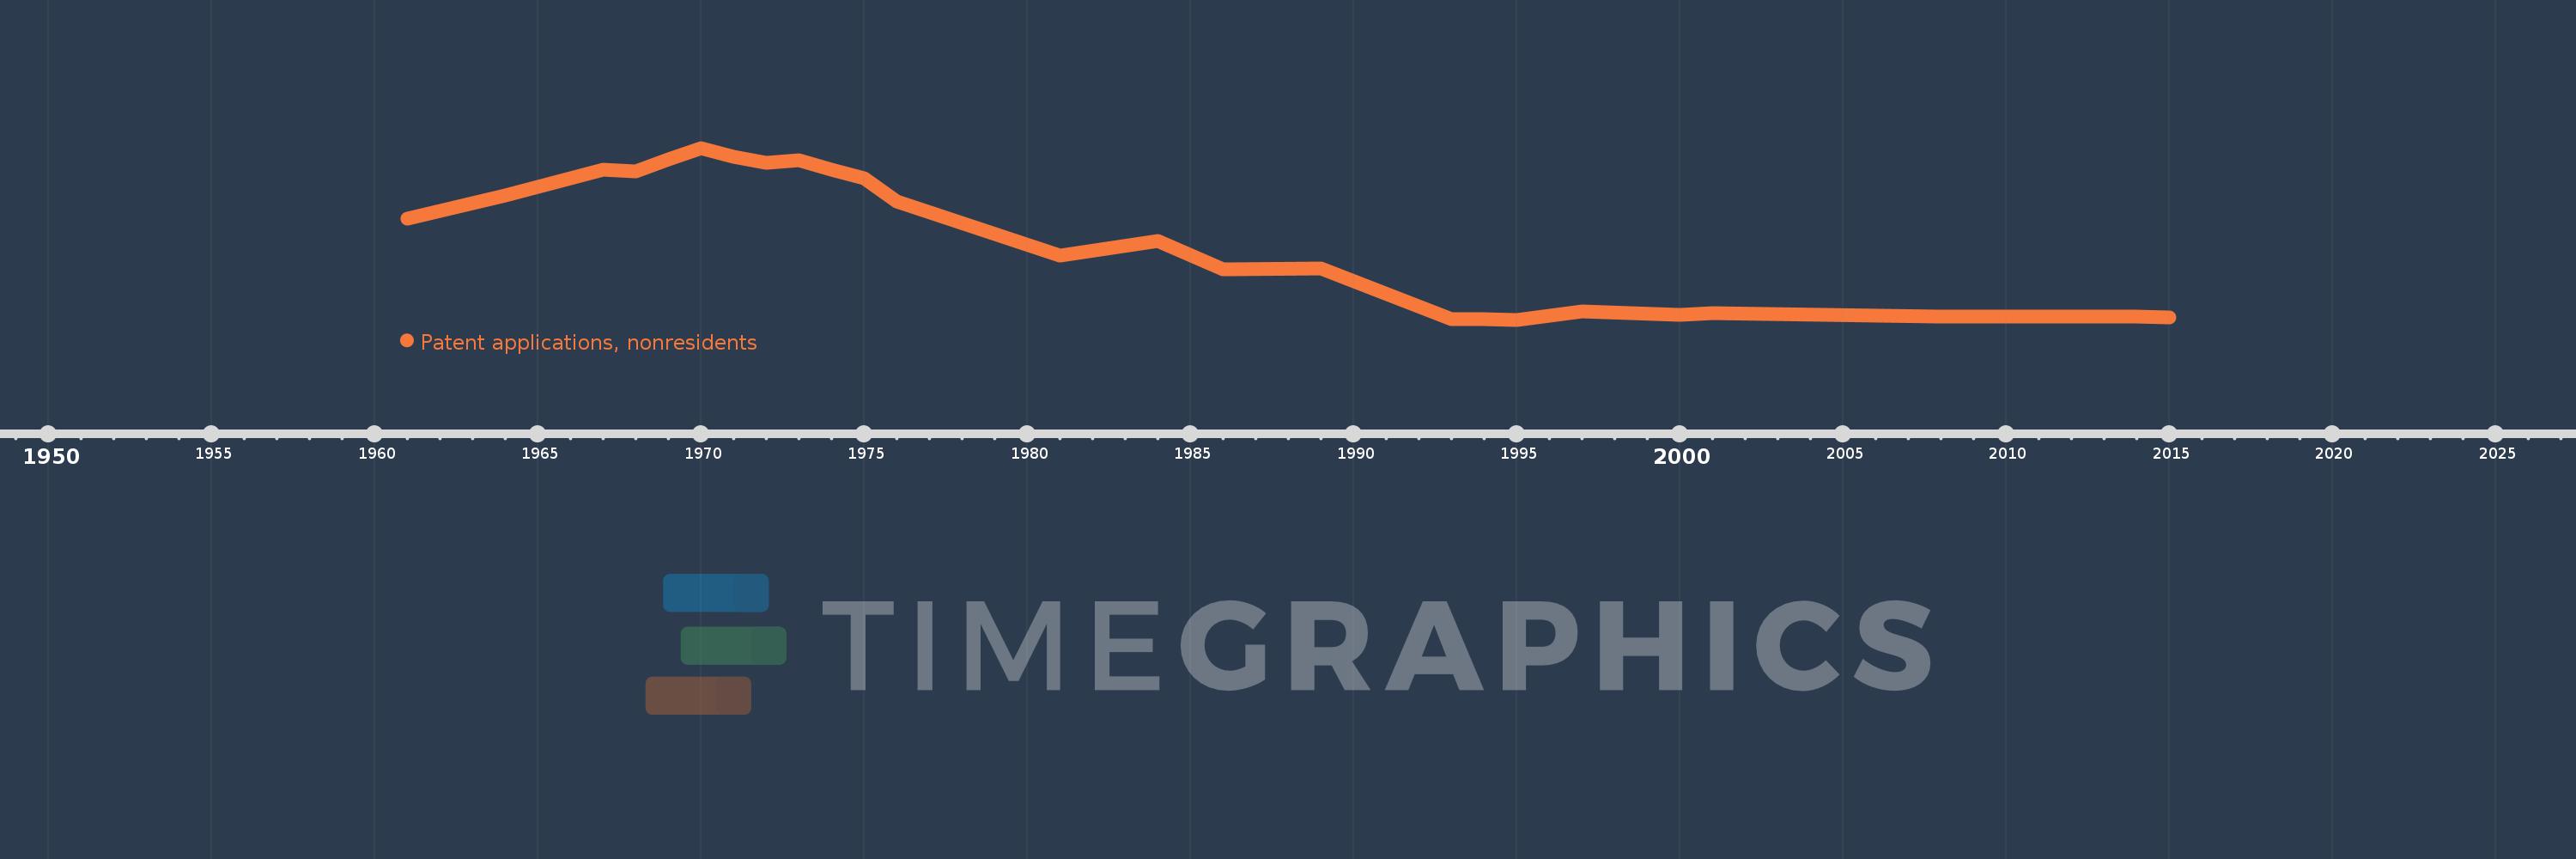
Patent applications, nonresidents
2015,2014,2013,2012,2011,2010,2009,2008,2001,2000,1997,1995,1994,1993,1989,1986,1984,1981,1976,1975,1974,1973,1972,1971,1970,1969,1968,1967,1964,1961
This statistics in other country:
AlbaniaAlgeriaAngolaAntigua and BarbudaArab WorldArgentinaArmeniaAustraliaAustriaAzerbaijanBahamas, TheBahrainBangladeshBarbadosBelarusBelgiumBelizeBhutanBoliviaBosnia and HerzegovinaBotswanaBrazilBrunei DarussalamBulgariaBurundiCambodiaCanadaCaribbean small statesCentral Europe and the BalticsChileChinaColombiaCongo, Dem. Rep.Congo, Rep.Costa RicaCote d'IvoireCroatiaCubaCyprusCzech RepublicDenmarkDjiboutiDominicaDominican RepublicEarly-demographic dividendEast Asia & PacificEast Asia & Pacific (excluding high income)East Asia & Pacific (IDA & IBRD countries)EcuadorEgypt, Arab Rep.El SalvadorEstoniaEthiopiaEuro areaEurope & Central AsiaEurope & Central Asia (excluding high income)Europe & Central Asia (IDA & IBRD countries)European UnionFijiFinlandFranceGambia, TheGeorgiaGermanyGhanaGreeceGrenadaGuatemalaGuyanaHaitiHigh incomeHondurasHong Kong SAR, ChinaHungaryIBRD onlyIcelandIDA & IBRD totalIDA blendIndiaIndonesiaIran, Islamic Rep.IraqIrelandIsraelItalyJamaicaJapanJordanKazakhstanKenyaKiribatiKorea, Dem. People’s Rep.Korea, Rep.KuwaitKyrgyz RepublicLao PDRLate-demographic dividendLatin America & Caribbean Latin America & Caribbean (excluding high income)Latin America & the Caribbean (IDA & IBRD countries)LatviaLebanonLesothoLiberiaLibyaLithuaniaLow & middle incomeLower middle incomeLuxembourgMacao SAR, ChinaMacedonia, FYRMadagascarMalawiMalaysiaMaliMaltaMauritiusMexicoMiddle East & North AfricaMiddle East & North Africa (excluding high income)Middle East & North Africa (IDA & IBRD countries)Middle incomeMoldovaMonacoMongoliaMontenegroMoroccoMozambiqueNamibiaNepalNetherlandsNew ZealandNicaraguaNigeriaNorth AmericaNorwayOECD membersPacific island small statesPakistanPanamaPapua New GuineaParaguayPeruPhilippinesPolandPortugalPost-demographic dividendQatarRomaniaRussian FederationRwandaSamoaSao Tome and PrincipeSaudi ArabiaSerbiaSeychellesSierra LeoneSingaporeSlovak RepublicSloveniaSolomon IslandsSomaliaSouth AfricaSouth AsiaSouth Asia (IDA & IBRD)SpainSri LankaSt. LuciaSt. Vincent and the GrenadinesSudanSwazilandSwedenSwitzerlandSyrian Arab RepublicTajikistanTanzaniaThailandTrinidad and TobagoTunisiaTurkeyTurkmenistanUgandaUkraineUnited Arab EmiratesUnited KingdomUnited StatesUpper middle incomeUruguayUzbekistanVenezuela, RBVietnamWorldYemen, Rep.ZambiaZimbabwe Timeline:
This timeline shows a graph from 1961 to 2015 of Italy. No data until 1960. Number of actual observations by date: 30.
Source name:
World Development Indicators
Source organization:
World Intellectual Property Organization (WIPO), WIPO Patent Report: Statistics on Worldwide Patent Activity. The International Bureau of WIPO assumes no responsibility with respect to the transformation of these data.
Categories, topics:
Science & Technology
Last updated:
apr 23, 2017
Indicators value changes by year
Maximum:
25.87K
jan 1, 1970
At the date of observation
Value
Absolute change
Change from previous value
jan 1, 1961
15.445K
+15.445K
0.0%
jan 1, 1964
18.895K
+3.45K
22.34%
jan 1, 1967
22.627K
+3.732K
19.75%
jan 1, 1968
22.337K
-290.0
-1.28%
jan 1, 1969
24.152K
+1.815K
8.13%
jan 1, 1970
25.87K
+1.718K
7.11%
jan 1, 1971
24.587K
-1.283K
-4.96%
jan 1, 1972
23.63K
-957.0
-3.89%
jan 1, 1973
24.083K
+453.0
1.92%
jan 1, 1974
22.612K
-1.471K
-6.11%
jan 1, 1975
21.423K
-1.189K
-5.26%
jan 1, 1976
17.995K
-3.428K
-16.0%
jan 1, 1981
9.971K
-8.024K
-44.59%
jan 1, 1984
12.08K
+2.109K
21.15%
jan 1, 1986
7.851K
-4.229K
-35.01%
jan 1, 1989
8.0K
+149.0
1.9%
jan 1, 1993
486.0
-7.514K
-93.92%
jan 1, 1994
483.0
-3.0
-0.62%
jan 1, 1995
439.0
-44.0
-9.11%
jan 1, 1997
1.678K
+1.239K
282.23%
jan 1, 2000
1.172K
-506.0
-30.15%
jan 1, 2001
1.396K
+224.0
19.11%
jan 1, 2008
870.0
-526.0
-37.68%
jan 1, 2009
861.0
-9.0
-1.03%
jan 1, 2010
903.0
+42.0
4.88%
jan 1, 2011
846.0
-57.0
-6.31%
jan 1, 2012
927.0
+81.0
9.57%
jan 1, 2013
871.0
-56.0
-6.04%
jan 1, 2014
905.0
+34.0
3.9%
jan 1, 2015
781.0
-124.0
-13.7%
Ranking of countries by current statistics by years


Comments: