29
/
en
AIzaSyAYiBZKx7MnpbEhh9jyipgxe19OcubqV5w
April 1, 2024
36065
High income
HIC
false
2
1
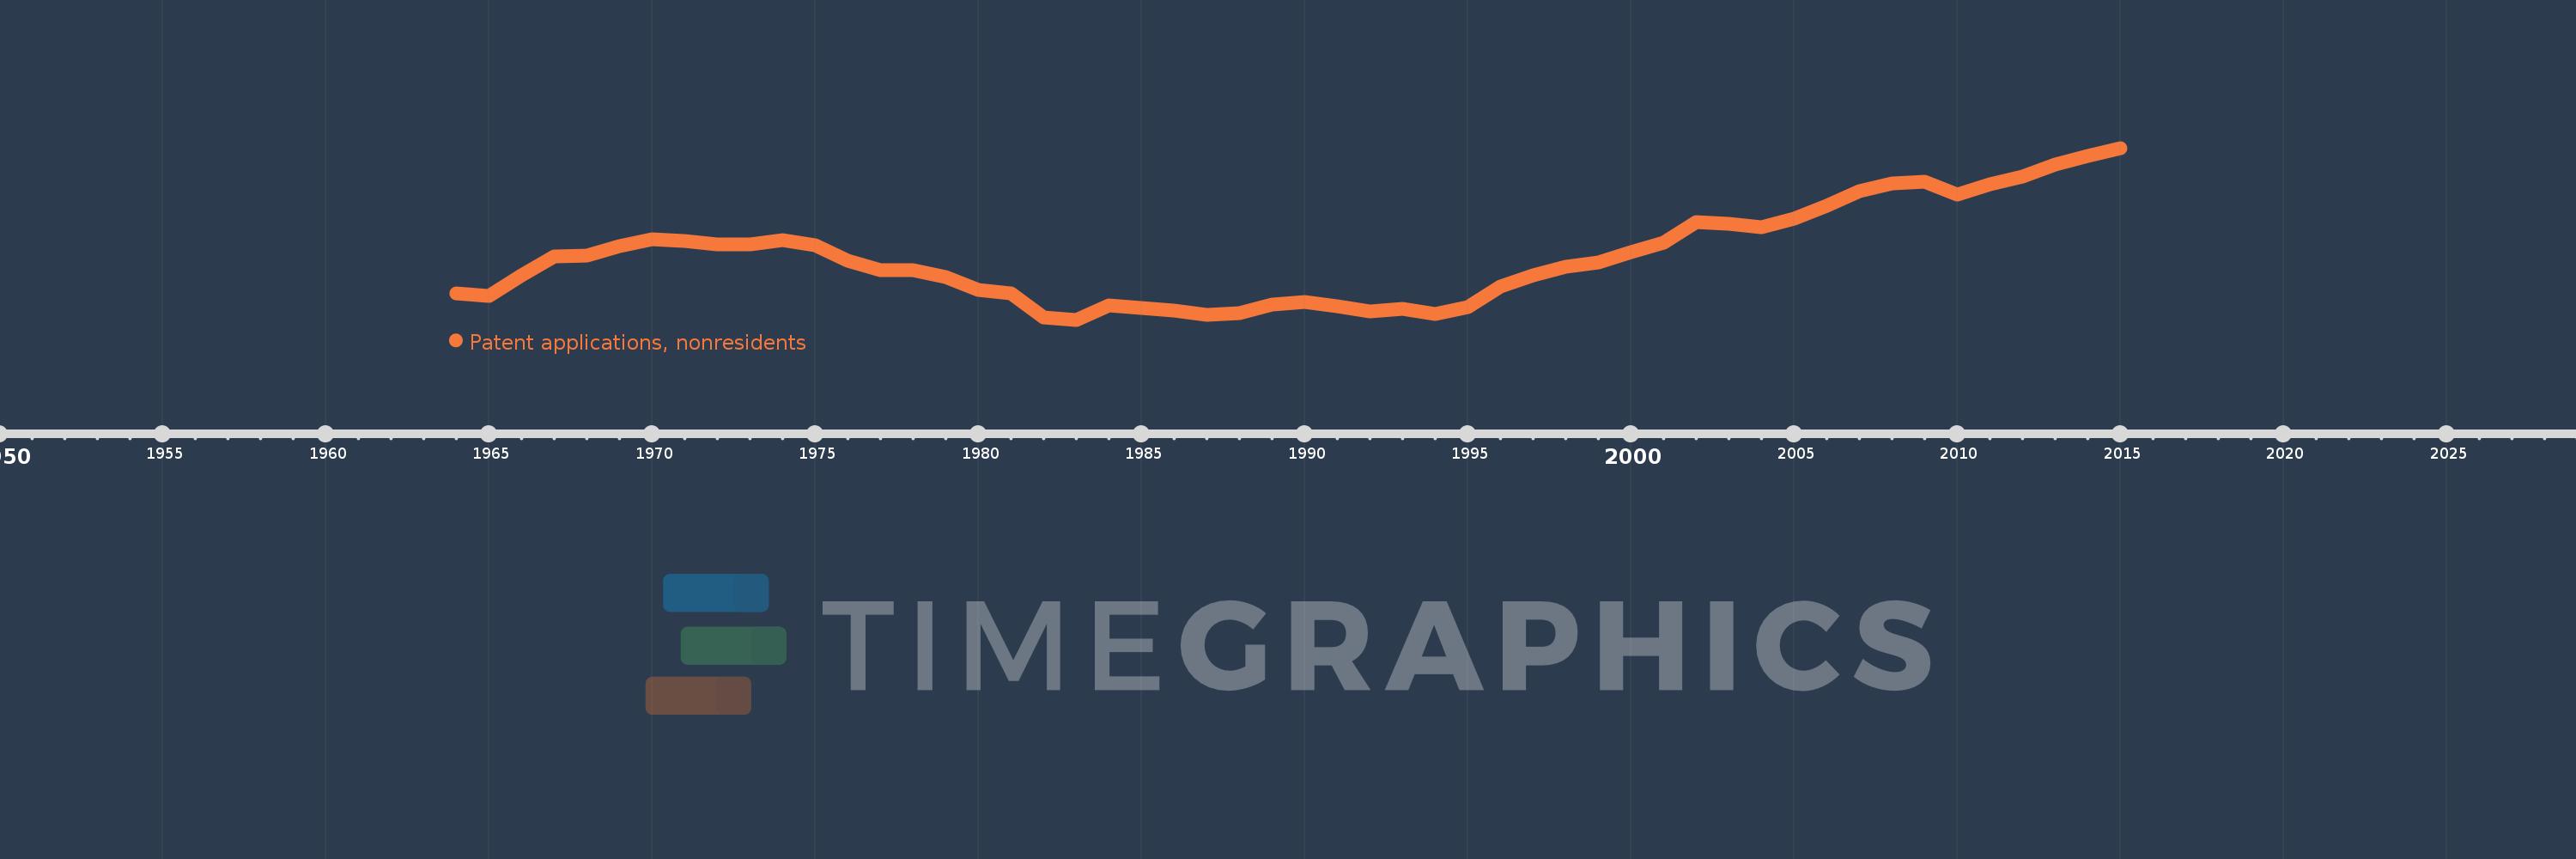
Patent applications, nonresidents
2015,2014,2013,2012,2011,2010,2009,2008,2007,2006,2005,2004,2003,2002,2001,2000,1999,1998,1997,1996,1995,1994,1993,1992,1991,1990,1989,1988,1987,1986,1985,1984,1983,1982,1981,1980,1979,1978,1977,1976,1975,1974,1973,1972,1971,1970,1969,1968,1967,1966,1965,1964
This statistics in other country:
AlbaniaAlgeriaAngolaAntigua and BarbudaArab WorldArgentinaArmeniaAustraliaAustriaAzerbaijanBahamas, TheBahrainBangladeshBarbadosBelarusBelgiumBelizeBhutanBoliviaBosnia and HerzegovinaBotswanaBrazilBrunei DarussalamBulgariaBurundiCambodiaCanadaCaribbean small statesCentral Europe and the BalticsChileChinaColombiaCongo, Dem. Rep.Congo, Rep.Costa RicaCote d'IvoireCroatiaCubaCyprusCzech RepublicDenmarkDjiboutiDominicaDominican RepublicEarly-demographic dividendEast Asia & PacificEast Asia & Pacific (excluding high income)East Asia & Pacific (IDA & IBRD countries)EcuadorEgypt, Arab Rep.El SalvadorEstoniaEthiopiaEuro areaEurope & Central AsiaEurope & Central Asia (excluding high income)Europe & Central Asia (IDA & IBRD countries)European UnionFijiFinlandFranceGambia, TheGeorgiaGermanyGhanaGreeceGrenadaGuatemalaGuyanaHaitiHigh incomeHondurasHong Kong SAR, ChinaHungaryIBRD onlyIcelandIDA & IBRD totalIDA blendIndiaIndonesiaIran, Islamic Rep.IraqIrelandIsraelItalyJamaicaJapanJordanKazakhstanKenyaKiribatiKorea, Dem. People’s Rep.Korea, Rep.KuwaitKyrgyz RepublicLao PDRLate-demographic dividendLatin America & Caribbean Latin America & Caribbean (excluding high income)Latin America & the Caribbean (IDA & IBRD countries)LatviaLebanonLesothoLiberiaLibyaLithuaniaLow & middle incomeLower middle incomeLuxembourgMacao SAR, ChinaMacedonia, FYRMadagascarMalawiMalaysiaMaliMaltaMauritiusMexicoMiddle East & North AfricaMiddle East & North Africa (excluding high income)Middle East & North Africa (IDA & IBRD countries)Middle incomeMoldovaMonacoMongoliaMontenegroMoroccoMozambiqueNamibiaNepalNetherlandsNew ZealandNicaraguaNigeriaNorth AmericaNorwayOECD membersPacific island small statesPakistanPanamaPapua New GuineaParaguayPeruPhilippinesPolandPortugalPost-demographic dividendQatarRomaniaRussian FederationRwandaSamoaSao Tome and PrincipeSaudi ArabiaSerbiaSeychellesSierra LeoneSingaporeSlovak RepublicSloveniaSolomon IslandsSomaliaSouth AfricaSouth AsiaSouth Asia (IDA & IBRD)SpainSri LankaSt. LuciaSt. Vincent and the GrenadinesSudanSwazilandSwedenSwitzerlandSyrian Arab RepublicTajikistanTanzaniaThailandTrinidad and TobagoTunisiaTurkeyTurkmenistanUgandaUkraineUnited Arab EmiratesUnited KingdomUnited StatesUpper middle incomeUruguayUzbekistanVenezuela, RBVietnamWorldYemen, Rep.ZambiaZimbabwe Timeline:
This timeline shows a graph from 1964 to 2015 of High income. No data until 1963. Number of actual observations by date: 52.
Source name:
World Development Indicators
Source organization:
World Intellectual Property Organization (WIPO), WIPO Patent Report: Statistics on Worldwide Patent Activity. The International Bureau of WIPO assumes no responsibility with respect to the transformation of these data.
Categories, topics:
Science & Technology
Last updated:
apr 23, 2017
Indicators value changes by year
Minimum:
180.558K
jan 1, 1983
Maximum:
525.691K
jan 1, 2015
At the date of observation
Value
Absolute change
Change from previous value
jan 1, 1964
233.455K
+233.455K
0.0%
jan 1, 1965
228.9K
-4.555K
-1.95%
jan 1, 1966
268.935K
+40.035K
17.49%
jan 1, 1967
306.962K
+38.027K
14.14%
jan 1, 1968
308.841K
+1.879K
0.61%
jan 1, 1969
328.079K
+19.238K
6.23%
jan 1, 1970
342.682K
+14.603K
4.45%
jan 1, 1971
339.336K
-3.346K
-0.98%
jan 1, 1972
332.275K
-7.061K
-2.08%
jan 1, 1973
332.698K
+423.0
0.13%
jan 1, 1974
340.11K
+7.412K
2.23%
jan 1, 1975
330.293K
-9.817K
-2.89%
jan 1, 1976
298.448K
-31.845K
-9.64%
jan 1, 1977
279.694K
-18.754K
-6.28%
jan 1, 1978
279.824K
+130.0
0.05%
jan 1, 1979
266.002K
-13.822K
-4.94%
jan 1, 1980
239.978K
-26.024K
-9.78%
jan 1, 1981
233.454K
-6.524K
-2.72%
jan 1, 1982
185.953K
-47.501K
-20.35%
jan 1, 1983
180.558K
-5.395K
-2.9%
jan 1, 1984
209.622K
+29.064K
16.1%
jan 1, 1985
204.364K
-5.258K
-2.51%
jan 1, 1986
199.026K
-5.338K
-2.61%
jan 1, 1987
191.22K
-7.806K
-3.92%
jan 1, 1988
194.02K
+2.8K
1.46%
jan 1, 1989
211.785K
+17.765K
9.16%
jan 1, 1990
215.756K
+3.971K
1.88%
jan 1, 1991
208.04K
-7.716K
-3.58%
jan 1, 1992
196.929K
-11.111K
-5.34%
jan 1, 1993
202.226K
+5.297K
2.69%
jan 1, 1994
191.678K
-10.548K
-5.22%
jan 1, 1995
205.643K
+13.965K
7.29%
jan 1, 1996
247.295K
+41.652K
20.25%
jan 1, 1997
269.859K
+22.564K
9.12%
jan 1, 1998
287.512K
+17.653K
6.54%
jan 1, 1999
295.691K
+8.179K
2.84%
jan 1, 2000
316.133K
+20.442K
6.91%
jan 1, 2001
335.126K
+18.993K
6.01%
jan 1, 2002
376.267K
+41.141K
12.28%
jan 1, 2003
373.758K
-2.509K
-0.67%
jan 1, 2004
366.136K
-7.622K
-2.04%
jan 1, 2005
383.364K
+17.228K
4.71%
jan 1, 2006
410.033K
+26.669K
6.96%
jan 1, 2007
438.037K
+28.004K
6.83%
jan 1, 2008
454.249K
+16.212K
3.7%
jan 1, 2009
457.528K
+3.279K
0.72%
jan 1, 2010
432.376K
-25.152K
-5.5%
jan 1, 2011
452.745K
+20.369K
4.71%
jan 1, 2012
468.69K
+15.945K
3.52%
jan 1, 2013
492.583K
+23.893K
5.1%
jan 1, 2014
510.113K
+17.53K
3.56%
jan 1, 2015
525.691K
+15.578K
3.05%
Ranking of countries by current statistics by years


Comments: