29
/
en
AIzaSyAYiBZKx7MnpbEhh9jyipgxe19OcubqV5w
April 1, 2024
228940
Romania
ROU
true
2
1
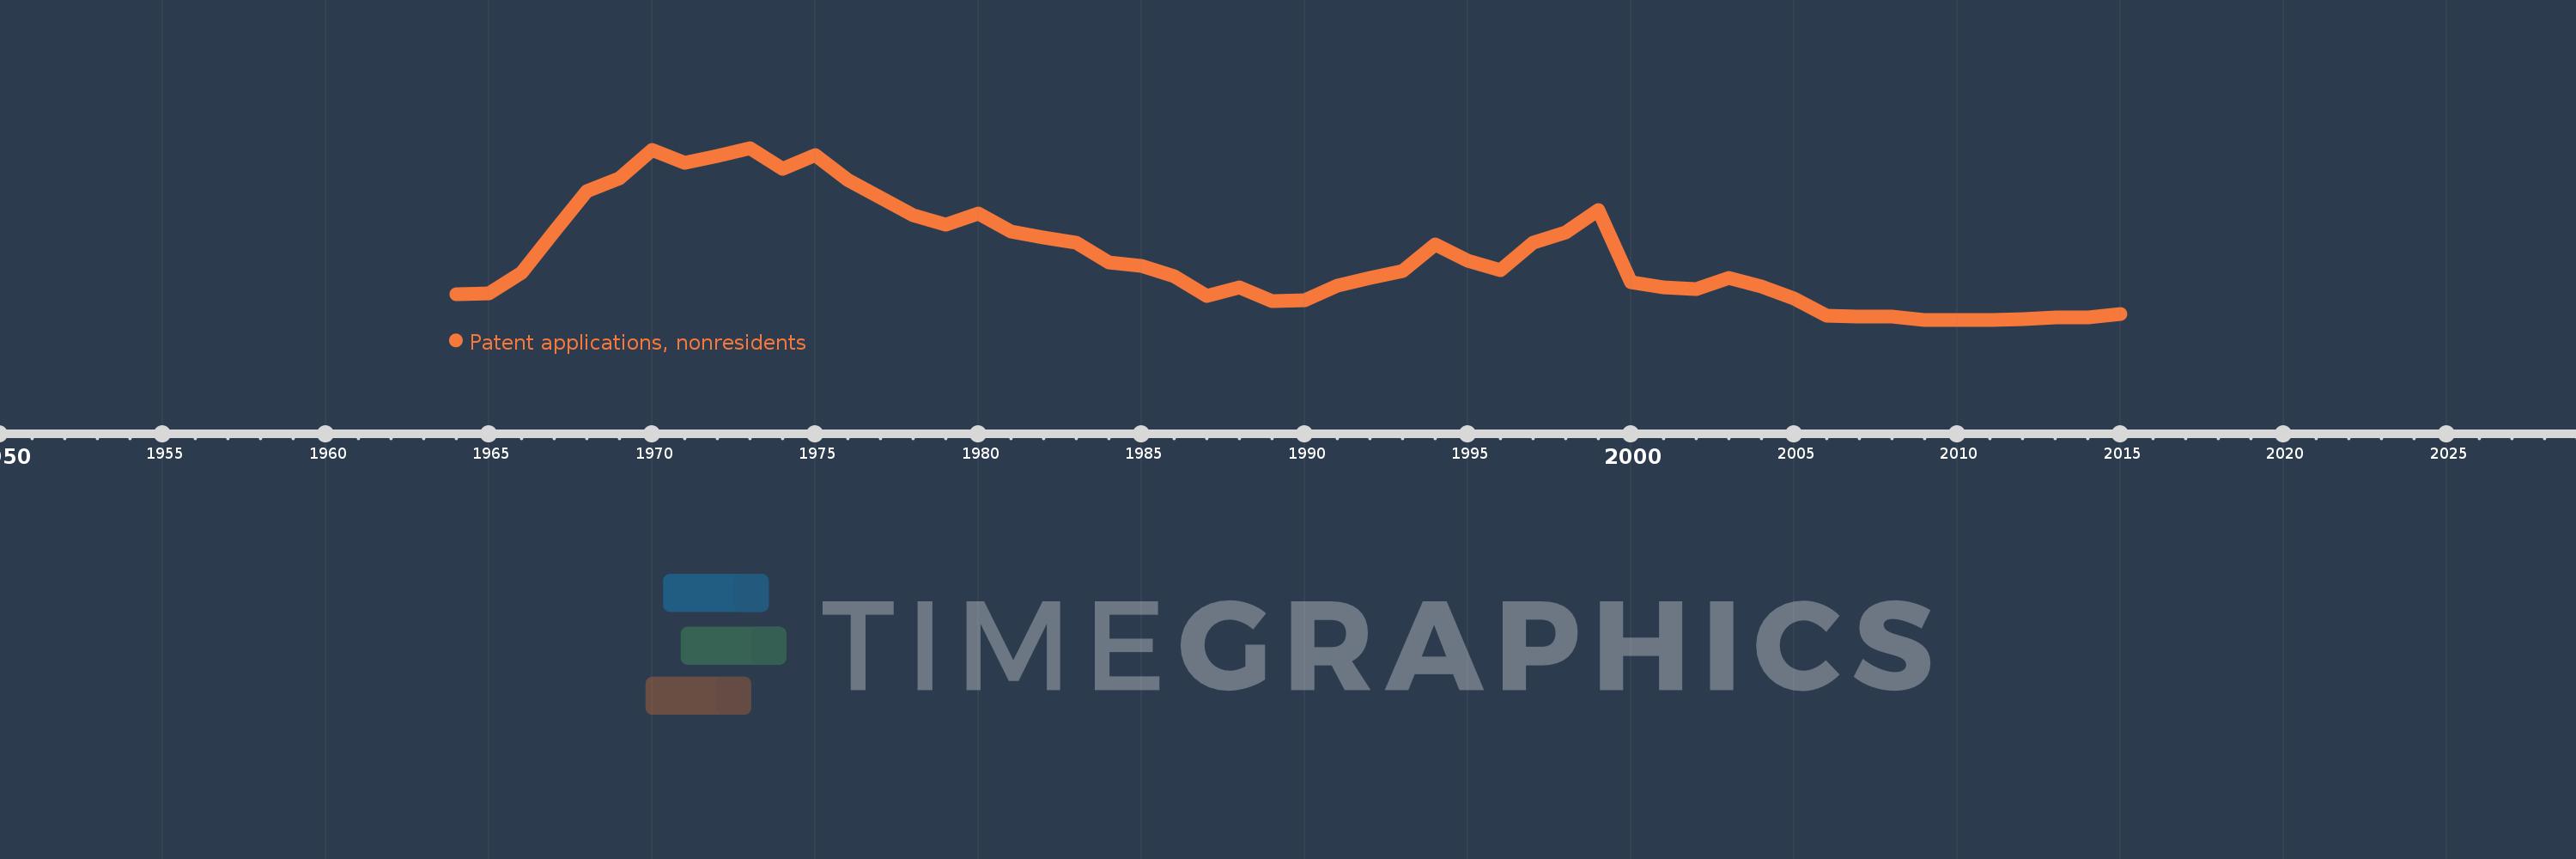
Patent applications, nonresidents
2015,2014,2013,2012,2011,2010,2009,2008,2007,2006,2005,2004,2003,2002,2001,2000,1999,1998,1997,1996,1995,1994,1993,1992,1991,1990,1989,1988,1987,1986,1985,1984,1983,1982,1981,1980,1979,1978,1976,1975,1974,1973,1972,1971,1970,1969,1968,1967,1966,1965,1964
This statistics in other country:
AlbaniaAlgeriaAngolaAntigua and BarbudaArab WorldArgentinaArmeniaAustraliaAustriaAzerbaijanBahamas, TheBahrainBangladeshBarbadosBelarusBelgiumBelizeBhutanBoliviaBosnia and HerzegovinaBotswanaBrazilBrunei DarussalamBulgariaBurundiCambodiaCanadaCaribbean small statesCentral Europe and the BalticsChileChinaColombiaCongo, Dem. Rep.Congo, Rep.Costa RicaCote d'IvoireCroatiaCubaCyprusCzech RepublicDenmarkDjiboutiDominicaDominican RepublicEarly-demographic dividendEast Asia & PacificEast Asia & Pacific (excluding high income)East Asia & Pacific (IDA & IBRD countries)EcuadorEgypt, Arab Rep.El SalvadorEstoniaEthiopiaEuro areaEurope & Central AsiaEurope & Central Asia (excluding high income)Europe & Central Asia (IDA & IBRD countries)European UnionFijiFinlandFranceGambia, TheGeorgiaGermanyGhanaGreeceGrenadaGuatemalaGuyanaHaitiHigh incomeHondurasHong Kong SAR, ChinaHungaryIBRD onlyIcelandIDA & IBRD totalIDA blendIndiaIndonesiaIran, Islamic Rep.IraqIrelandIsraelItalyJamaicaJapanJordanKazakhstanKenyaKiribatiKorea, Dem. People’s Rep.Korea, Rep.KuwaitKyrgyz RepublicLao PDRLate-demographic dividendLatin America & Caribbean Latin America & Caribbean (excluding high income)Latin America & the Caribbean (IDA & IBRD countries)LatviaLebanonLesothoLiberiaLibyaLithuaniaLow & middle incomeLower middle incomeLuxembourgMacao SAR, ChinaMacedonia, FYRMadagascarMalawiMalaysiaMaliMaltaMauritiusMexicoMiddle East & North AfricaMiddle East & North Africa (excluding high income)Middle East & North Africa (IDA & IBRD countries)Middle incomeMoldovaMonacoMongoliaMontenegroMoroccoMozambiqueNamibiaNepalNetherlandsNew ZealandNicaraguaNigeriaNorth AmericaNorwayOECD membersPacific island small statesPakistanPanamaPapua New GuineaParaguayPeruPhilippinesPolandPortugalPost-demographic dividendQatarRomaniaRussian FederationRwandaSamoaSao Tome and PrincipeSaudi ArabiaSerbiaSeychellesSierra LeoneSingaporeSlovak RepublicSloveniaSolomon IslandsSomaliaSouth AfricaSouth AsiaSouth Asia (IDA & IBRD)SpainSri LankaSt. LuciaSt. Vincent and the GrenadinesSudanSwazilandSwedenSwitzerlandSyrian Arab RepublicTajikistanTanzaniaThailandTrinidad and TobagoTunisiaTurkeyTurkmenistanUgandaUkraineUnited Arab EmiratesUnited KingdomUnited StatesUpper middle incomeUruguayUzbekistanVenezuela, RBVietnamWorldYemen, Rep.ZambiaZimbabwe Timeline:
This timeline shows a graph from 1964 to 2015 of Romania. No data until 1963. Number of actual observations by date: 51.
Source name:
World Development Indicators
Source organization:
World Intellectual Property Organization (WIPO), WIPO Patent Report: Statistics on Worldwide Patent Activity. The International Bureau of WIPO assumes no responsibility with respect to the transformation of these data.
Categories, topics:
Science & Technology
Last updated:
apr 23, 2017
Indicators value changes by year
At the date of observation
Value
Absolute change
Change from previous value
jan 1, 1964
237.0
+237.0
0.0%
jan 1, 1965
240.0
+3.0
1.27%
jan 1, 1966
401.0
+161.0
67.08%
jan 1, 1967
725.0
+324.0
80.8%
jan 1, 1968
1.043K
+318.0
43.86%
jan 1, 1969
1.14K
+97.0
9.3%
jan 1, 1970
1.366K
+226.0
19.82%
jan 1, 1971
1.261K
-105.0
-7.69%
jan 1, 1972
1.318K
+57.0
4.52%
jan 1, 1973
1.38K
+62.0
4.7%
jan 1, 1974
1.215K
-165.0
-11.96%
jan 1, 1975
1.325K
+110.0
9.05%
jan 1, 1976
1.126K
-199.0
-15.02%
jan 1, 1978
853.0
-273.0
-24.25%
jan 1, 1979
780.0
-73.0
-8.56%
jan 1, 1980
869.0
+89.0
11.41%
jan 1, 1981
726.0
-143.0
-16.46%
jan 1, 1982
681.0
-45.0
-6.2%
jan 1, 1983
638.0
-43.0
-6.31%
jan 1, 1984
487.0
-151.0
-23.67%
jan 1, 1985
457.0
-30.0
-6.16%
jan 1, 1986
379.0
-78.0
-17.07%
jan 1, 1987
225.0
-154.0
-40.63%
jan 1, 1988
291.0
+66.0
29.33%
jan 1, 1989
181.0
-110.0
-37.8%
jan 1, 1990
191.0
+10.0
5.52%
jan 1, 1991
304.0
+113.0
59.16%
jan 1, 1992
361.0
+57.0
18.75%
jan 1, 1993
420.0
+59.0
16.34%
jan 1, 1994
628.0
+208.0
49.52%
jan 1, 1995
500.0
-128.0
-20.38%
jan 1, 1996
421.0
-79.0
-15.8%
jan 1, 1997
636.0
+215.0
51.07%
jan 1, 1998
722.0
+86.0
13.52%
jan 1, 1999
894.0
+172.0
23.82%
jan 1, 2000
330.0
-564.0
-63.09%
jan 1, 2001
287.0
-43.0
-13.03%
jan 1, 2002
277.0
-10.0
-3.48%
jan 1, 2003
363.0
+86.0
31.05%
jan 1, 2004
293.0
-70.0
-19.28%
jan 1, 2005
200.0
-93.0
-31.74%
jan 1, 2006
68.0
-132.0
-66.0%
jan 1, 2007
62.0
-6.0
-8.82%
jan 1, 2008
59.0
-3.0
-4.84%
jan 1, 2009
36.0
-23.0
-38.98%
jan 1, 2010
37.0
+1.0
2.78%
jan 1, 2011
36.0
-1.0
-2.7%
jan 1, 2012
39.0
+3.0
8.33%
jan 1, 2013
55.0
+16.0
41.03%
jan 1, 2014
53.0
-2.0
-3.64%
jan 1, 2015
84.0
+31.0
58.49%
Ranking of countries by current statistics by years


Comments: