29
/
en
AIzaSyAYiBZKx7MnpbEhh9jyipgxe19OcubqV5w
April 1, 2024
268448
Tunisia
TUN
true
2
1
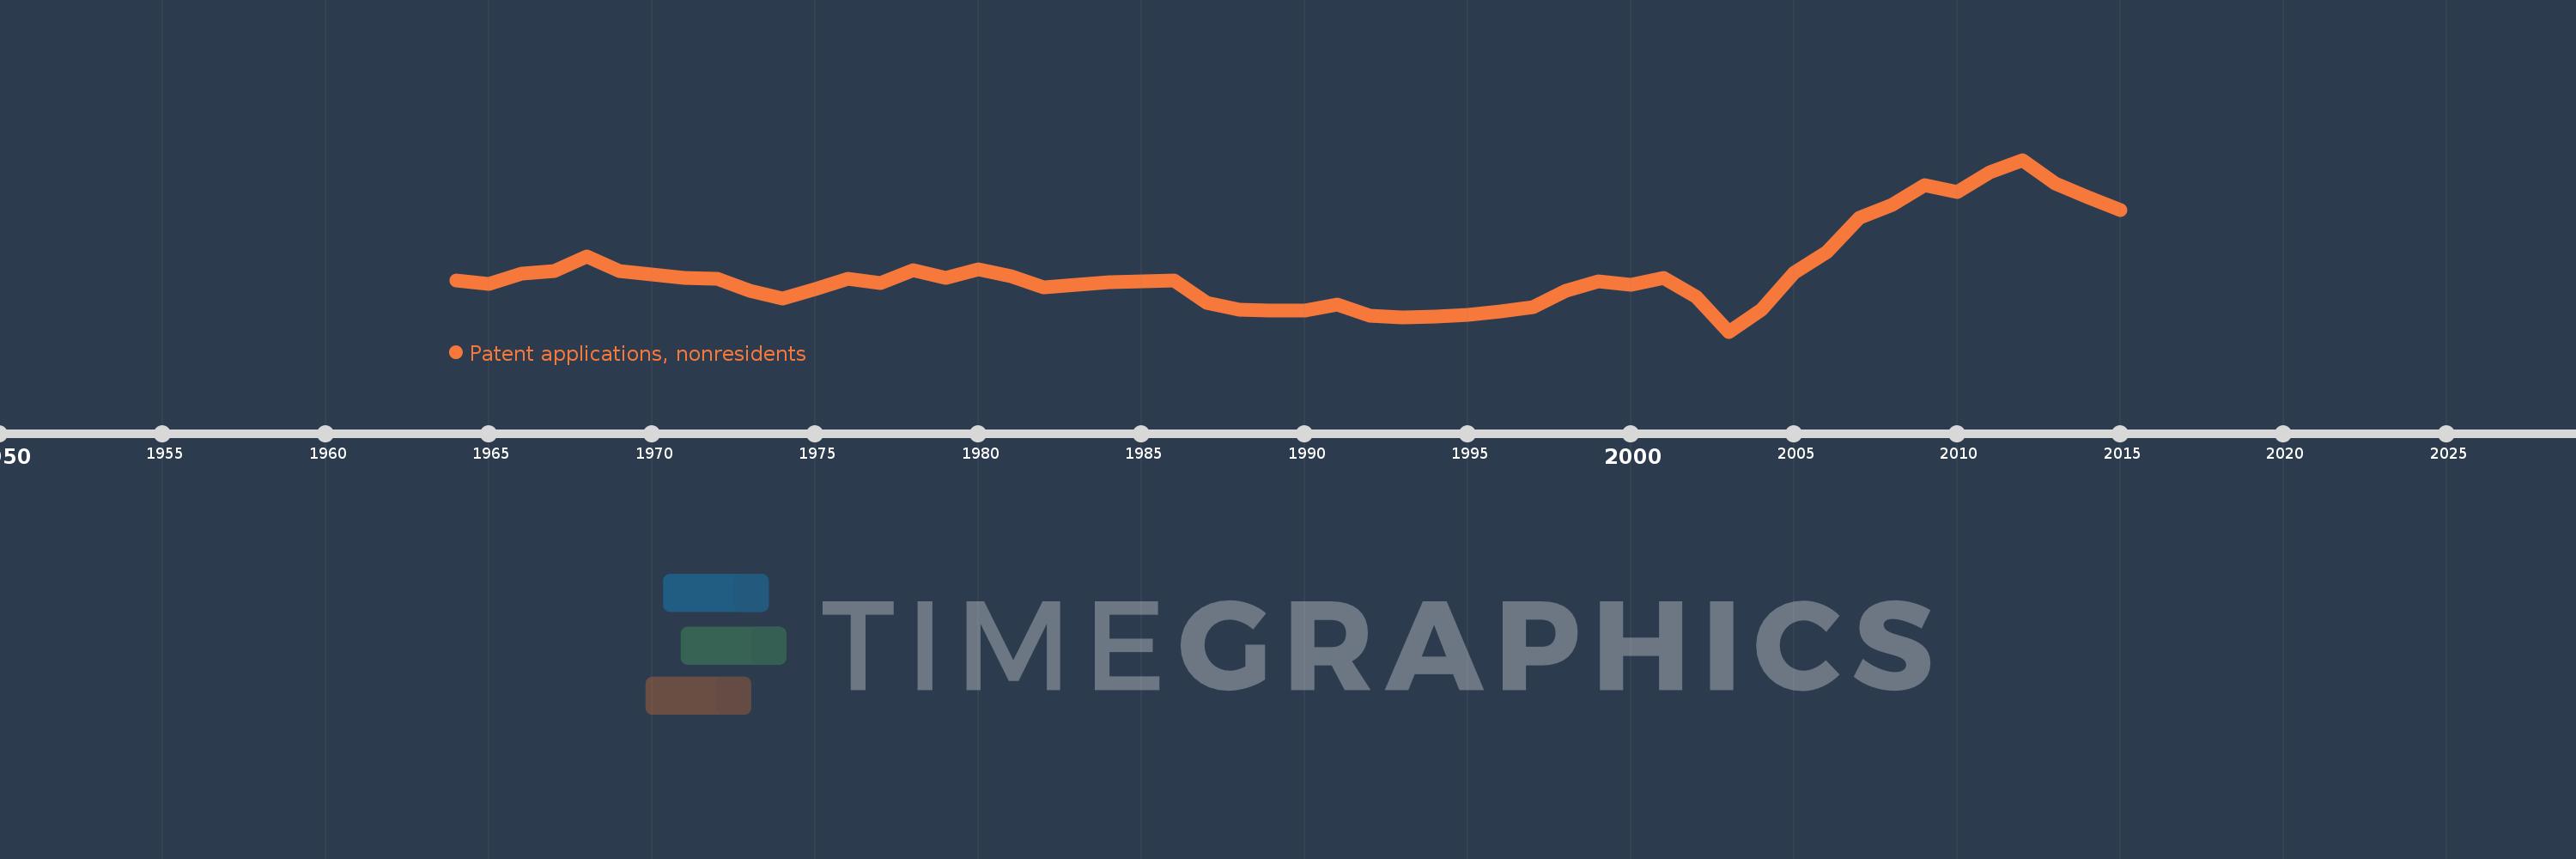
Patent applications, nonresidents
2015,2014,2013,2012,2011,2010,2009,2008,2007,2006,2005,2004,2003,2002,2001,2000,1999,1998,1997,1996,1995,1994,1993,1992,1991,1990,1989,1988,1987,1986,1985,1984,1982,1981,1980,1979,1978,1977,1976,1975,1974,1973,1972,1971,1969,1968,1967,1966,1965,1964
This statistics in other country:
AlbaniaAlgeriaAngolaAntigua and BarbudaArab WorldArgentinaArmeniaAustraliaAustriaAzerbaijanBahamas, TheBahrainBangladeshBarbadosBelarusBelgiumBelizeBhutanBoliviaBosnia and HerzegovinaBotswanaBrazilBrunei DarussalamBulgariaBurundiCambodiaCanadaCaribbean small statesCentral Europe and the BalticsChileChinaColombiaCongo, Dem. Rep.Congo, Rep.Costa RicaCote d'IvoireCroatiaCubaCyprusCzech RepublicDenmarkDjiboutiDominicaDominican RepublicEarly-demographic dividendEast Asia & PacificEast Asia & Pacific (excluding high income)East Asia & Pacific (IDA & IBRD countries)EcuadorEgypt, Arab Rep.El SalvadorEstoniaEthiopiaEuro areaEurope & Central AsiaEurope & Central Asia (excluding high income)Europe & Central Asia (IDA & IBRD countries)European UnionFijiFinlandFranceGambia, TheGeorgiaGermanyGhanaGreeceGrenadaGuatemalaGuyanaHaitiHigh incomeHondurasHong Kong SAR, ChinaHungaryIBRD onlyIcelandIDA & IBRD totalIDA blendIndiaIndonesiaIran, Islamic Rep.IraqIrelandIsraelItalyJamaicaJapanJordanKazakhstanKenyaKiribatiKorea, Dem. People’s Rep.Korea, Rep.KuwaitKyrgyz RepublicLao PDRLate-demographic dividendLatin America & Caribbean Latin America & Caribbean (excluding high income)Latin America & the Caribbean (IDA & IBRD countries)LatviaLebanonLesothoLiberiaLibyaLithuaniaLow & middle incomeLower middle incomeLuxembourgMacao SAR, ChinaMacedonia, FYRMadagascarMalawiMalaysiaMaliMaltaMauritiusMexicoMiddle East & North AfricaMiddle East & North Africa (excluding high income)Middle East & North Africa (IDA & IBRD countries)Middle incomeMoldovaMonacoMongoliaMontenegroMoroccoMozambiqueNamibiaNepalNetherlandsNew ZealandNicaraguaNigeriaNorth AmericaNorwayOECD membersPacific island small statesPakistanPanamaPapua New GuineaParaguayPeruPhilippinesPolandPortugalPost-demographic dividendQatarRomaniaRussian FederationRwandaSamoaSao Tome and PrincipeSaudi ArabiaSerbiaSeychellesSierra LeoneSingaporeSlovak RepublicSloveniaSolomon IslandsSomaliaSouth AfricaSouth AsiaSouth Asia (IDA & IBRD)SpainSri LankaSt. LuciaSt. Vincent and the GrenadinesSudanSwazilandSwedenSwitzerlandSyrian Arab RepublicTajikistanTanzaniaThailandTrinidad and TobagoTunisiaTurkeyTurkmenistanUgandaUkraineUnited Arab EmiratesUnited KingdomUnited StatesUpper middle incomeUruguayUzbekistanVenezuela, RBVietnamWorldYemen, Rep.ZambiaZimbabwe Timeline:
This timeline shows a graph from 1964 to 2015 of Tunisia. No data until 1963. Number of actual observations by date: 50.
Source name:
World Development Indicators
Source organization:
World Intellectual Property Organization (WIPO), WIPO Patent Report: Statistics on Worldwide Patent Activity. The International Bureau of WIPO assumes no responsibility with respect to the transformation of these data.
Categories, topics:
Science & Technology
Last updated:
apr 23, 2017
Indicators value changes by year
At the date of observation
Value
Absolute change
Change from previous value
jan 1, 1964
202.0
+202.0
0.0%
jan 1, 1965
192.0
-10.0
-4.95%
jan 1, 1966
221.0
+29.0
15.1%
jan 1, 1967
229.0
+8.0
3.62%
jan 1, 1968
271.0
+42.0
18.34%
jan 1, 1969
228.0
-43.0
-15.87%
jan 1, 1971
209.0
-19.0
-8.33%
jan 1, 1972
206.0
-3.0
-1.44%
jan 1, 1973
173.0
-33.0
-16.02%
jan 1, 1974
151.0
-22.0
-12.72%
jan 1, 1975
178.0
+27.0
17.88%
jan 1, 1976
207.0
+29.0
16.29%
jan 1, 1977
195.0
-12.0
-5.8%
jan 1, 1978
232.0
+37.0
18.97%
jan 1, 1979
210.0
-22.0
-9.48%
jan 1, 1980
235.0
+25.0
11.9%
jan 1, 1981
214.0
-21.0
-8.94%
jan 1, 1982
183.0
-31.0
-14.49%
jan 1, 1984
197.0
+14.0
7.65%
jan 1, 1985
201.0
+4.0
2.03%
jan 1, 1986
202.0
+1.0
0.5%
jan 1, 1987
139.0
-63.0
-31.19%
jan 1, 1988
120.0
-19.0
-13.67%
jan 1, 1989
118.0
-2.0
-1.67%
jan 1, 1990
118.0
0.0
0.0%
jan 1, 1991
134.0
+16.0
13.56%
jan 1, 1992
104.0
-30.0
-22.39%
jan 1, 1993
98.0
-6.0
-5.77%
jan 1, 1994
100.0
+2.0
2.04%
jan 1, 1995
106.0
+6.0
6.0%
jan 1, 1996
115.0
+9.0
8.49%
jan 1, 1997
128.0
+13.0
11.3%
jan 1, 1998
174.0
+46.0
35.94%
jan 1, 1999
200.0
+26.0
14.94%
jan 1, 2000
190.0
-10.0
-5.0%
jan 1, 2001
210.0
+20.0
10.53%
jan 1, 2002
156.0
-54.0
-25.71%
jan 1, 2003
58.0
-98.0
-62.82%
jan 1, 2004
120.0
+62.0
106.9%
jan 1, 2005
223.0
+103.0
85.83%
jan 1, 2006
282.0
+59.0
26.46%
jan 1, 2007
379.0
+97.0
34.4%
jan 1, 2008
416.0
+37.0
9.76%
jan 1, 2009
472.0
+56.0
13.46%
jan 1, 2010
452.0
-20.0
-4.24%
jan 1, 2011
508.0
+56.0
12.39%
jan 1, 2012
543.0
+35.0
6.89%
jan 1, 2013
476.0
-67.0
-12.34%
jan 1, 2014
437.0
-39.0
-8.19%
jan 1, 2015
400.0
-37.0
-8.47%
Ranking of countries by current statistics by years


Comments: