29
/
en
AIzaSyAYiBZKx7MnpbEhh9jyipgxe19OcubqV5w
April 1, 2024
226271
Portugal
PRT
true
2
1
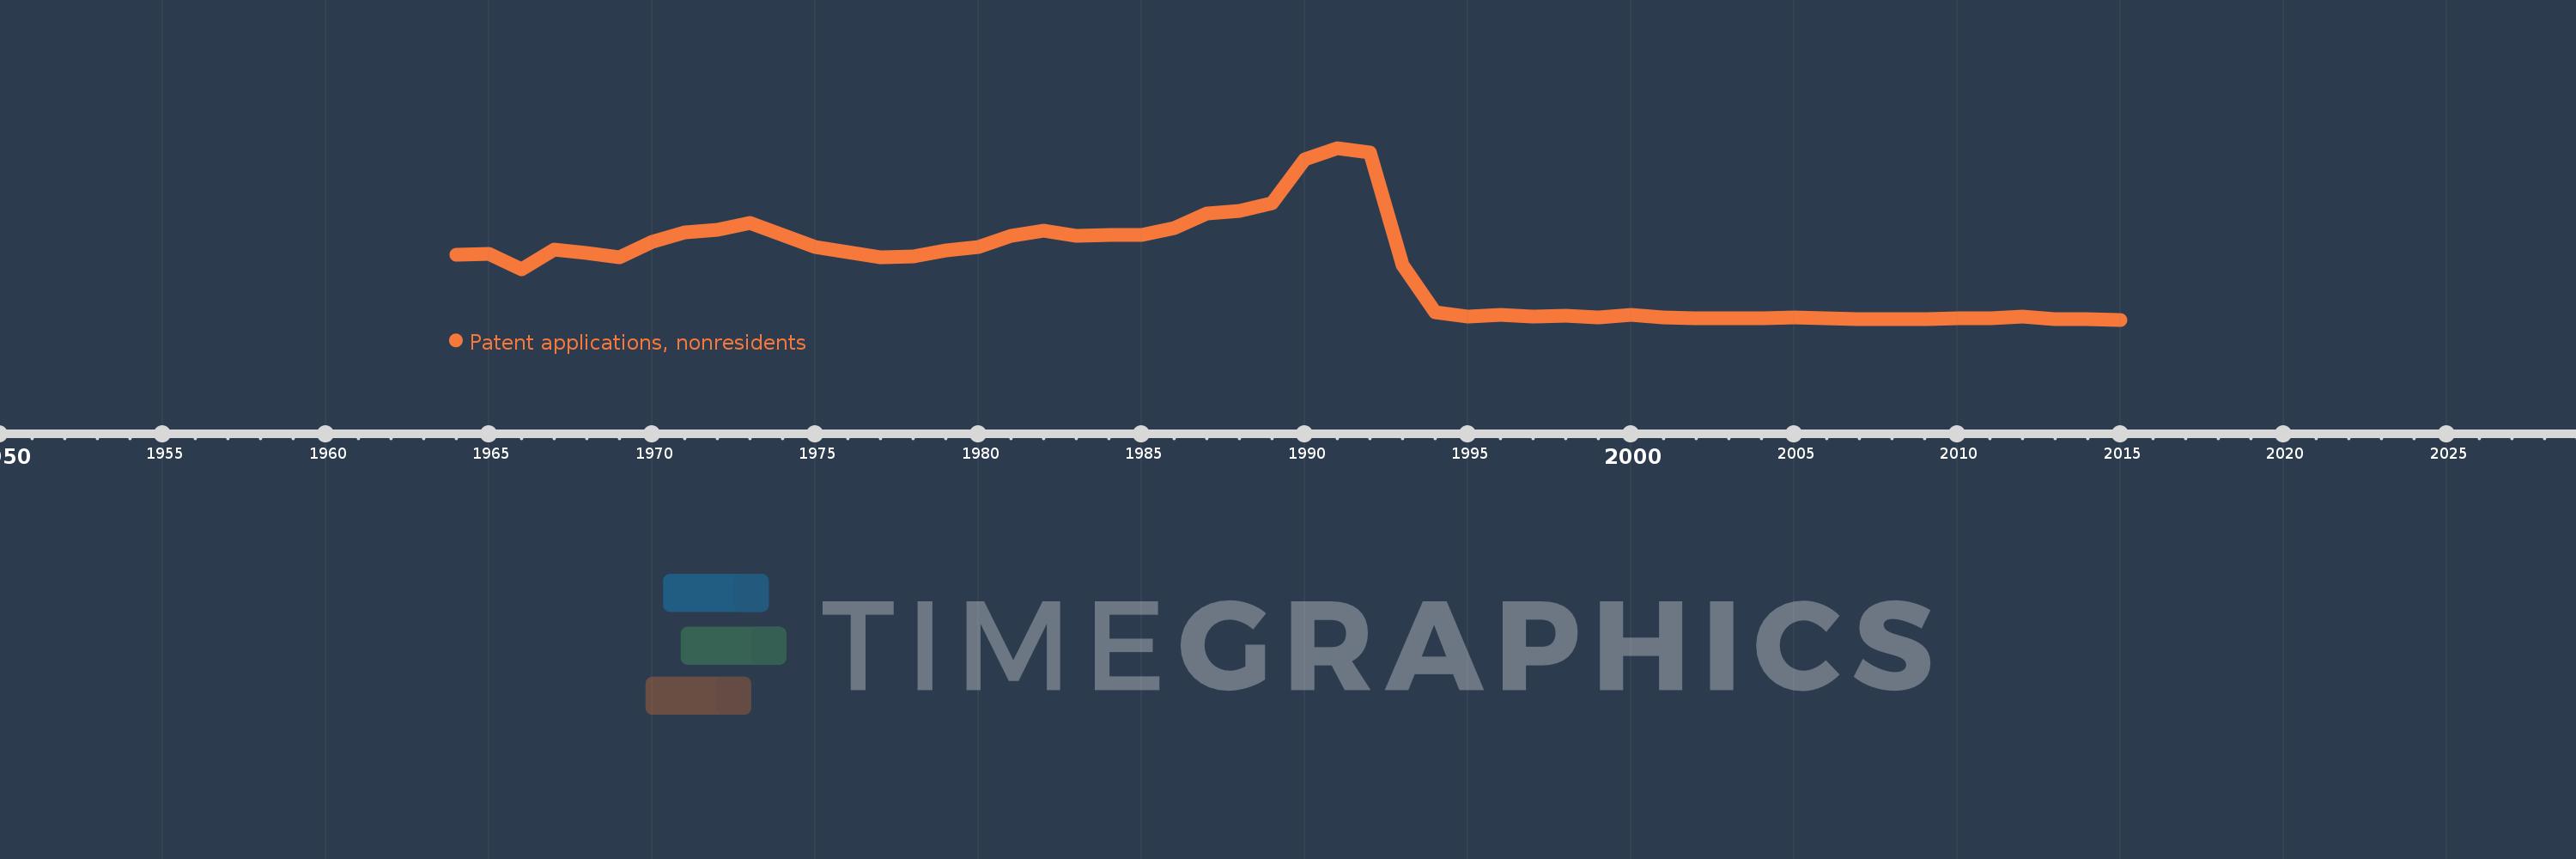
Patent applications, nonresidents
2015,2014,2013,2012,2011,2010,2009,2008,2007,2006,2005,2004,2003,2002,2001,2000,1999,1998,1997,1996,1995,1994,1993,1992,1991,1990,1989,1988,1987,1986,1985,1984,1983,1982,1981,1980,1979,1978,1977,1976,1975,1974,1973,1972,1971,1970,1969,1968,1967,1966,1965,1964
This statistics in other country:
AlbaniaAlgeriaAngolaAntigua and BarbudaArab WorldArgentinaArmeniaAustraliaAustriaAzerbaijanBahamas, TheBahrainBangladeshBarbadosBelarusBelgiumBelizeBhutanBoliviaBosnia and HerzegovinaBotswanaBrazilBrunei DarussalamBulgariaBurundiCambodiaCanadaCaribbean small statesCentral Europe and the BalticsChileChinaColombiaCongo, Dem. Rep.Congo, Rep.Costa RicaCote d'IvoireCroatiaCubaCyprusCzech RepublicDenmarkDjiboutiDominicaDominican RepublicEarly-demographic dividendEast Asia & PacificEast Asia & Pacific (excluding high income)East Asia & Pacific (IDA & IBRD countries)EcuadorEgypt, Arab Rep.El SalvadorEstoniaEthiopiaEuro areaEurope & Central AsiaEurope & Central Asia (excluding high income)Europe & Central Asia (IDA & IBRD countries)European UnionFijiFinlandFranceGambia, TheGeorgiaGermanyGhanaGreeceGrenadaGuatemalaGuyanaHaitiHigh incomeHondurasHong Kong SAR, ChinaHungaryIBRD onlyIcelandIDA & IBRD totalIDA blendIndiaIndonesiaIran, Islamic Rep.IraqIrelandIsraelItalyJamaicaJapanJordanKazakhstanKenyaKiribatiKorea, Dem. People’s Rep.Korea, Rep.KuwaitKyrgyz RepublicLao PDRLate-demographic dividendLatin America & Caribbean Latin America & Caribbean (excluding high income)Latin America & the Caribbean (IDA & IBRD countries)LatviaLebanonLesothoLiberiaLibyaLithuaniaLow & middle incomeLower middle incomeLuxembourgMacao SAR, ChinaMacedonia, FYRMadagascarMalawiMalaysiaMaliMaltaMauritiusMexicoMiddle East & North AfricaMiddle East & North Africa (excluding high income)Middle East & North Africa (IDA & IBRD countries)Middle incomeMoldovaMonacoMongoliaMontenegroMoroccoMozambiqueNamibiaNepalNetherlandsNew ZealandNicaraguaNigeriaNorth AmericaNorwayOECD membersPacific island small statesPakistanPanamaPapua New GuineaParaguayPeruPhilippinesPolandPortugalPost-demographic dividendQatarRomaniaRussian FederationRwandaSamoaSao Tome and PrincipeSaudi ArabiaSerbiaSeychellesSierra LeoneSingaporeSlovak RepublicSloveniaSolomon IslandsSomaliaSouth AfricaSouth AsiaSouth Asia (IDA & IBRD)SpainSri LankaSt. LuciaSt. Vincent and the GrenadinesSudanSwazilandSwedenSwitzerlandSyrian Arab RepublicTajikistanTanzaniaThailandTrinidad and TobagoTunisiaTurkeyTurkmenistanUgandaUkraineUnited Arab EmiratesUnited KingdomUnited StatesUpper middle incomeUruguayUzbekistanVenezuela, RBVietnamWorldYemen, Rep.ZambiaZimbabwe Timeline:
This timeline shows a graph from 1964 to 2015 of Portugal. No data until 1963. Number of actual observations by date: 52.
Source name:
World Development Indicators
Source organization:
World Intellectual Property Organization (WIPO), WIPO Patent Report: Statistics on Worldwide Patent Activity. The International Bureau of WIPO assumes no responsibility with respect to the transformation of these data.
Categories, topics:
Science & Technology
Last updated:
apr 23, 2017
Indicators value changes by year
Maximum:
3.541K
jan 1, 1991
At the date of observation
Value
Absolute change
Change from previous value
jan 1, 1964
1.347K
+1.347K
0.0%
jan 1, 1965
1.371K
+24.0
1.78%
jan 1, 1966
1.048K
-323.0
-23.56%
jan 1, 1967
1.459K
+411.0
39.22%
jan 1, 1968
1.378K
-81.0
-5.55%
jan 1, 1969
1.304K
-74.0
-5.37%
jan 1, 1970
1.623K
+319.0
24.46%
jan 1, 1971
1.817K
+194.0
11.95%
jan 1, 1972
1.863K
+46.0
2.53%
jan 1, 1973
2.002K
+139.0
7.46%
jan 1, 1974
1.753K
-249.0
-12.44%
jan 1, 1975
1.503K
-250.0
-14.26%
jan 1, 1976
1.404K
-99.0
-6.59%
jan 1, 1977
1.293K
-111.0
-7.91%
jan 1, 1978
1.324K
+31.0
2.4%
jan 1, 1979
1.438K
+114.0
8.61%
jan 1, 1980
1.51K
+72.0
5.01%
jan 1, 1981
1.731K
+221.0
14.64%
jan 1, 1982
1.843K
+112.0
6.47%
jan 1, 1983
1.734K
-109.0
-5.91%
jan 1, 1984
1.76K
+26.0
1.5%
jan 1, 1985
1.756K
-4.0
-0.23%
jan 1, 1986
1.906K
+150.0
8.54%
jan 1, 1987
2.191K
+285.0
14.95%
jan 1, 1988
2.258K
+67.0
3.06%
jan 1, 1989
2.41K
+152.0
6.73%
jan 1, 1990
3.311K
+901.0
37.39%
jan 1, 1991
3.541K
+230.0
6.95%
jan 1, 1992
3.453K
-88.0
-2.49%
jan 1, 1993
1.138K
-2.315K
-67.04%
jan 1, 1994
180.0
-958.0
-84.18%
jan 1, 1995
88.0
-92.0
-51.11%
jan 1, 1996
120.0
+32.0
36.36%
jan 1, 1997
76.0
-44.0
-36.67%
jan 1, 1998
101.0
+25.0
32.89%
jan 1, 1999
61.0
-40.0
-39.6%
jan 1, 2000
114.0
+53.0
86.89%
jan 1, 2001
65.0
-49.0
-42.98%
jan 1, 2002
56.0
-9.0
-13.85%
jan 1, 2003
49.0
-7.0
-12.5%
jan 1, 2004
40.0
-9.0
-18.37%
jan 1, 2005
64.0
+24.0
60.0%
jan 1, 2006
47.0
-17.0
-26.56%
jan 1, 2007
36.0
-11.0
-23.4%
jan 1, 2008
31.0
-5.0
-13.89%
jan 1, 2009
24.0
-7.0
-22.58%
jan 1, 2010
46.0
+22.0
91.67%
jan 1, 2012
75.0
+29.0
63.04%
jan 1, 2013
26.0
-49.0
-65.33%
jan 1, 2014
22.0
-4.0
-15.38%
jan 1, 2015
18.0
-4.0
-18.18%
Ranking of countries by current statistics by years


Comments: