29
/
en
AIzaSyAYiBZKx7MnpbEhh9jyipgxe19OcubqV5w
April 1, 2024
182434
Luxembourg
LUX
true
2
1
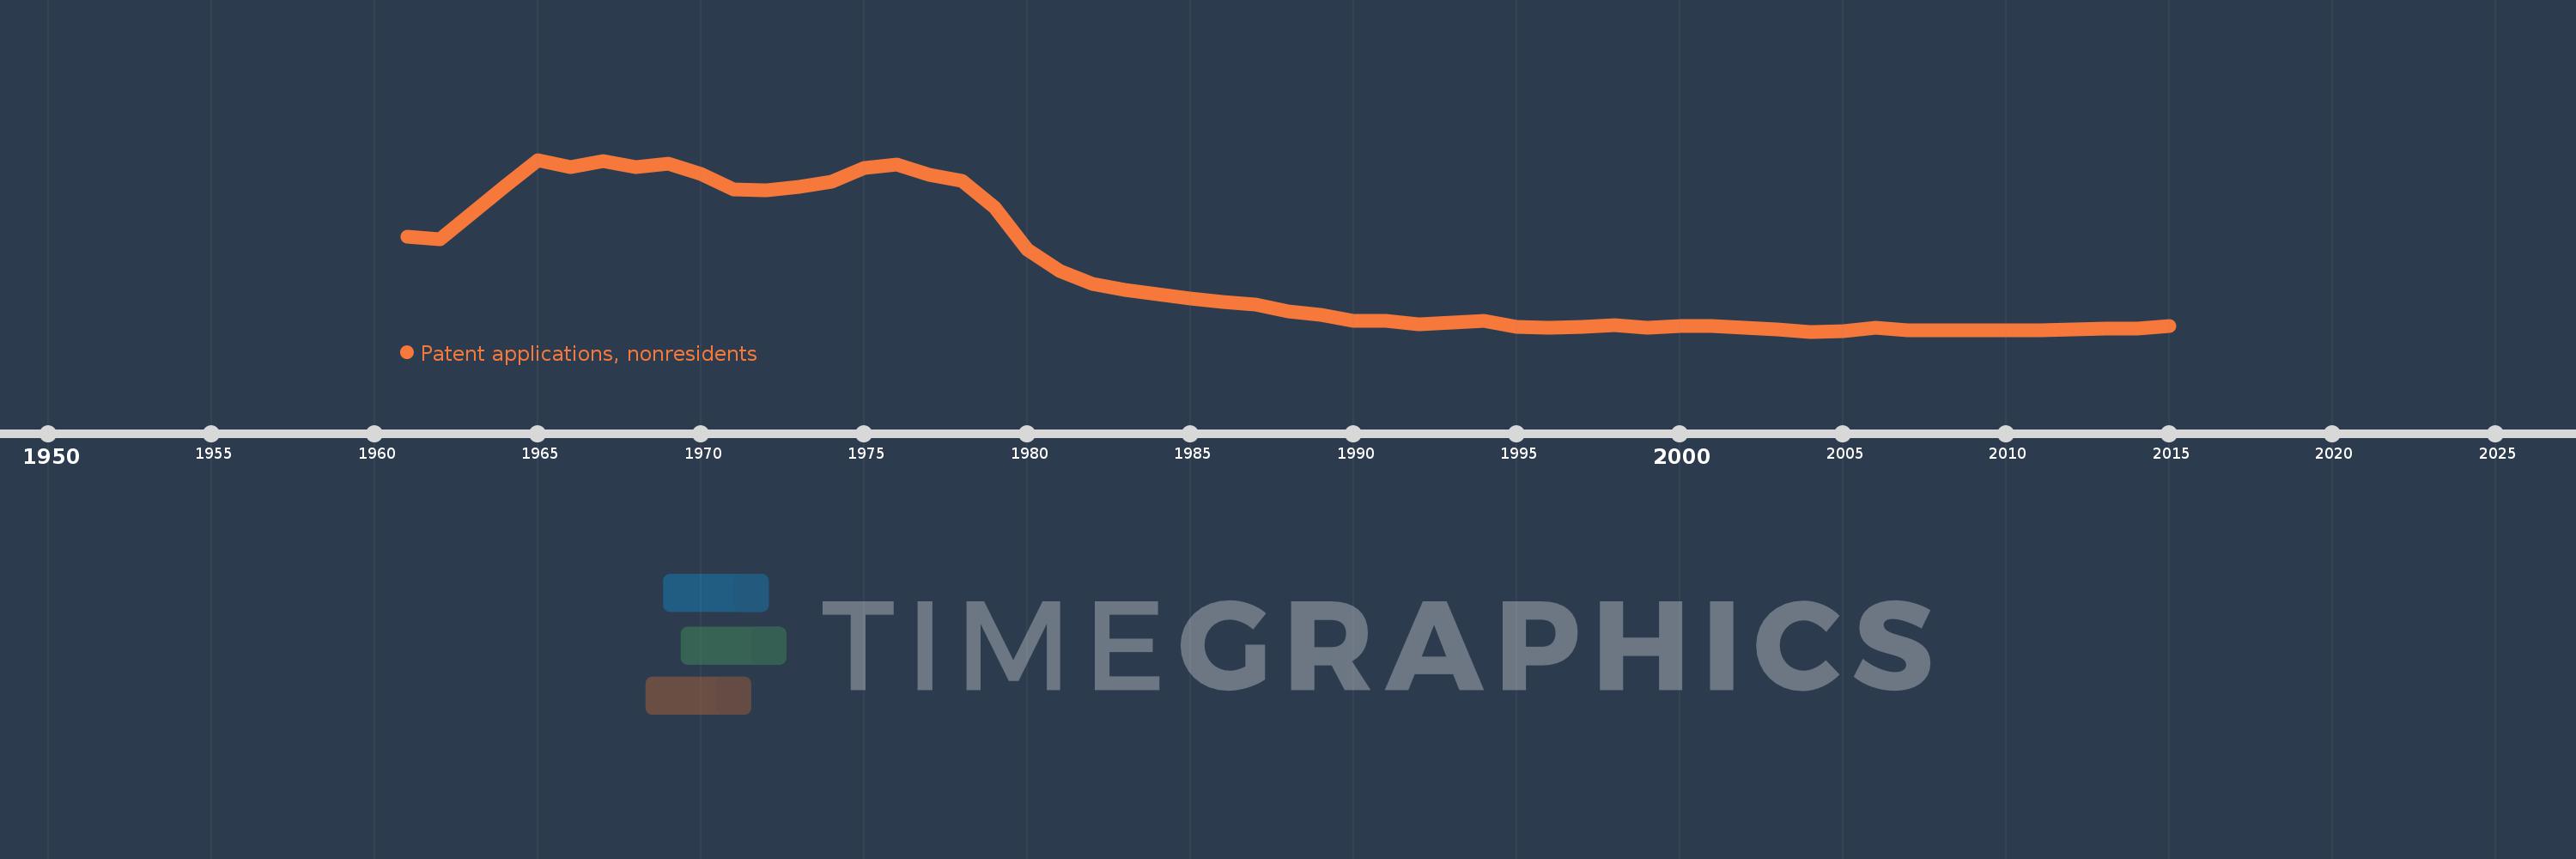
Patent applications, nonresidents
2015,2014,2013,2012,2011,2010,2009,2008,2007,2006,2005,2004,2003,2002,2001,2000,1999,1998,1997,1996,1995,1994,1992,1991,1990,1989,1988,1987,1986,1985,1983,1982,1981,1980,1979,1978,1977,1976,1975,1974,1973,1972,1971,1970,1969,1968,1967,1966,1965,1964,1962,1961
This statistics in other country:
AlbaniaAlgeriaAngolaAntigua and BarbudaArab WorldArgentinaArmeniaAustraliaAustriaAzerbaijanBahamas, TheBahrainBangladeshBarbadosBelarusBelgiumBelizeBhutanBoliviaBosnia and HerzegovinaBotswanaBrazilBrunei DarussalamBulgariaBurundiCambodiaCanadaCaribbean small statesCentral Europe and the BalticsChileChinaColombiaCongo, Dem. Rep.Congo, Rep.Costa RicaCote d'IvoireCroatiaCubaCyprusCzech RepublicDenmarkDjiboutiDominicaDominican RepublicEarly-demographic dividendEast Asia & PacificEast Asia & Pacific (excluding high income)East Asia & Pacific (IDA & IBRD countries)EcuadorEgypt, Arab Rep.El SalvadorEstoniaEthiopiaEuro areaEurope & Central AsiaEurope & Central Asia (excluding high income)Europe & Central Asia (IDA & IBRD countries)European UnionFijiFinlandFranceGambia, TheGeorgiaGermanyGhanaGreeceGrenadaGuatemalaGuyanaHaitiHigh incomeHondurasHong Kong SAR, ChinaHungaryIBRD onlyIcelandIDA & IBRD totalIDA blendIndiaIndonesiaIran, Islamic Rep.IraqIrelandIsraelItalyJamaicaJapanJordanKazakhstanKenyaKiribatiKorea, Dem. People’s Rep.Korea, Rep.KuwaitKyrgyz RepublicLao PDRLate-demographic dividendLatin America & Caribbean Latin America & Caribbean (excluding high income)Latin America & the Caribbean (IDA & IBRD countries)LatviaLebanonLesothoLiberiaLibyaLithuaniaLow & middle incomeLower middle incomeLuxembourgMacao SAR, ChinaMacedonia, FYRMadagascarMalawiMalaysiaMaliMaltaMauritiusMexicoMiddle East & North AfricaMiddle East & North Africa (excluding high income)Middle East & North Africa (IDA & IBRD countries)Middle incomeMoldovaMonacoMongoliaMontenegroMoroccoMozambiqueNamibiaNepalNetherlandsNew ZealandNicaraguaNigeriaNorth AmericaNorwayOECD membersPacific island small statesPakistanPanamaPapua New GuineaParaguayPeruPhilippinesPolandPortugalPost-demographic dividendQatarRomaniaRussian FederationRwandaSamoaSao Tome and PrincipeSaudi ArabiaSerbiaSeychellesSierra LeoneSingaporeSlovak RepublicSloveniaSolomon IslandsSomaliaSouth AfricaSouth AsiaSouth Asia (IDA & IBRD)SpainSri LankaSt. LuciaSt. Vincent and the GrenadinesSudanSwazilandSwedenSwitzerlandSyrian Arab RepublicTajikistanTanzaniaThailandTrinidad and TobagoTunisiaTurkeyTurkmenistanUgandaUkraineUnited Arab EmiratesUnited KingdomUnited StatesUpper middle incomeUruguayUzbekistanVenezuela, RBVietnamWorldYemen, Rep.ZambiaZimbabwe Timeline:
This timeline shows a graph from 1961 to 2015 of Luxembourg. No data until 1960. Number of actual observations by date: 52.
Source name:
World Development Indicators
Source organization:
World Intellectual Property Organization (WIPO), WIPO Patent Report: Statistics on Worldwide Patent Activity. The International Bureau of WIPO assumes no responsibility with respect to the transformation of these data.
Categories, topics:
Science & Technology
Last updated:
apr 23, 2017
Indicators value changes by year
Maximum:
2.515K
jan 1, 1965
At the date of observation
Value
Absolute change
Change from previous value
jan 1, 1961
1.399K
+1.399K
0.0%
jan 1, 1962
1.352K
-47.0
-3.36%
jan 1, 1964
2.13K
+778.0
57.54%
jan 1, 1965
2.515K
+385.0
18.08%
jan 1, 1966
2.406K
-109.0
-4.33%
jan 1, 1967
2.493K
+87.0
3.62%
jan 1, 1968
2.406K
-87.0
-3.49%
jan 1, 1969
2.463K
+57.0
2.37%
jan 1, 1970
2.307K
-156.0
-6.33%
jan 1, 1971
2.087K
-220.0
-9.54%
jan 1, 1972
2.069K
-18.0
-0.86%
jan 1, 1973
2.123K
+54.0
2.61%
jan 1, 1974
2.2K
+77.0
3.63%
jan 1, 1975
2.398K
+198.0
9.0%
jan 1, 1976
2.444K
+46.0
1.92%
jan 1, 1977
2.301K
-143.0
-5.85%
jan 1, 1978
2.209K
-92.0
-4.0%
jan 1, 1979
1.825K
-384.0
-17.38%
jan 1, 1980
1.21K
-615.0
-33.7%
jan 1, 1981
897.0
-313.0
-25.87%
jan 1, 1982
708.0
-189.0
-21.07%
jan 1, 1983
616.0
-92.0
-12.99%
jan 1, 1985
496.0
-120.0
-19.48%
jan 1, 1986
439.0
-57.0
-11.49%
jan 1, 1987
407.0
-32.0
-7.29%
jan 1, 1988
300.0
-107.0
-26.29%
jan 1, 1989
248.0
-52.0
-17.33%
jan 1, 1990
169.0
-79.0
-31.85%
jan 1, 1991
165.0
-4.0
-2.37%
jan 1, 1992
119.0
-46.0
-27.88%
jan 1, 1994
166.0
+47.0
39.5%
jan 1, 1995
74.0
-92.0
-55.42%
jan 1, 1996
69.0
-5.0
-6.76%
jan 1, 1997
77.0
+8.0
11.59%
jan 1, 1998
102.0
+25.0
32.47%
jan 1, 1999
68.0
-34.0
-33.33%
jan 1, 2000
86.0
+18.0
26.47%
jan 1, 2001
91.0
+5.0
5.81%
jan 1, 2002
70.0
-21.0
-23.08%
jan 1, 2003
42.0
-28.0
-40.0%
jan 1, 2004
8.0
-34.0
-80.95%
jan 1, 2005
18.0
+10.0
125.0%
jan 1, 2006
64.0
+46.0
255.56%
jan 1, 2007
26.0
-38.0
-59.38%
jan 1, 2008
25.0
-1.0
-3.85%
jan 1, 2009
23.0
-2.0
-8.0%
jan 1, 2010
24.0
+1.0
4.35%
jan 1, 2011
21.0
-3.0
-12.5%
jan 1, 2012
43.0
+22.0
104.76%
jan 1, 2013
52.0
+9.0
20.93%
jan 1, 2014
56.0
+4.0
7.69%
jan 1, 2015
90.0
+34.0
60.71%
Ranking of countries by current statistics by years


Comments: