29
/
en
AIzaSyAYiBZKx7MnpbEhh9jyipgxe19OcubqV5w
April 1, 2024
269806
Turkey
TUR
true
2
1
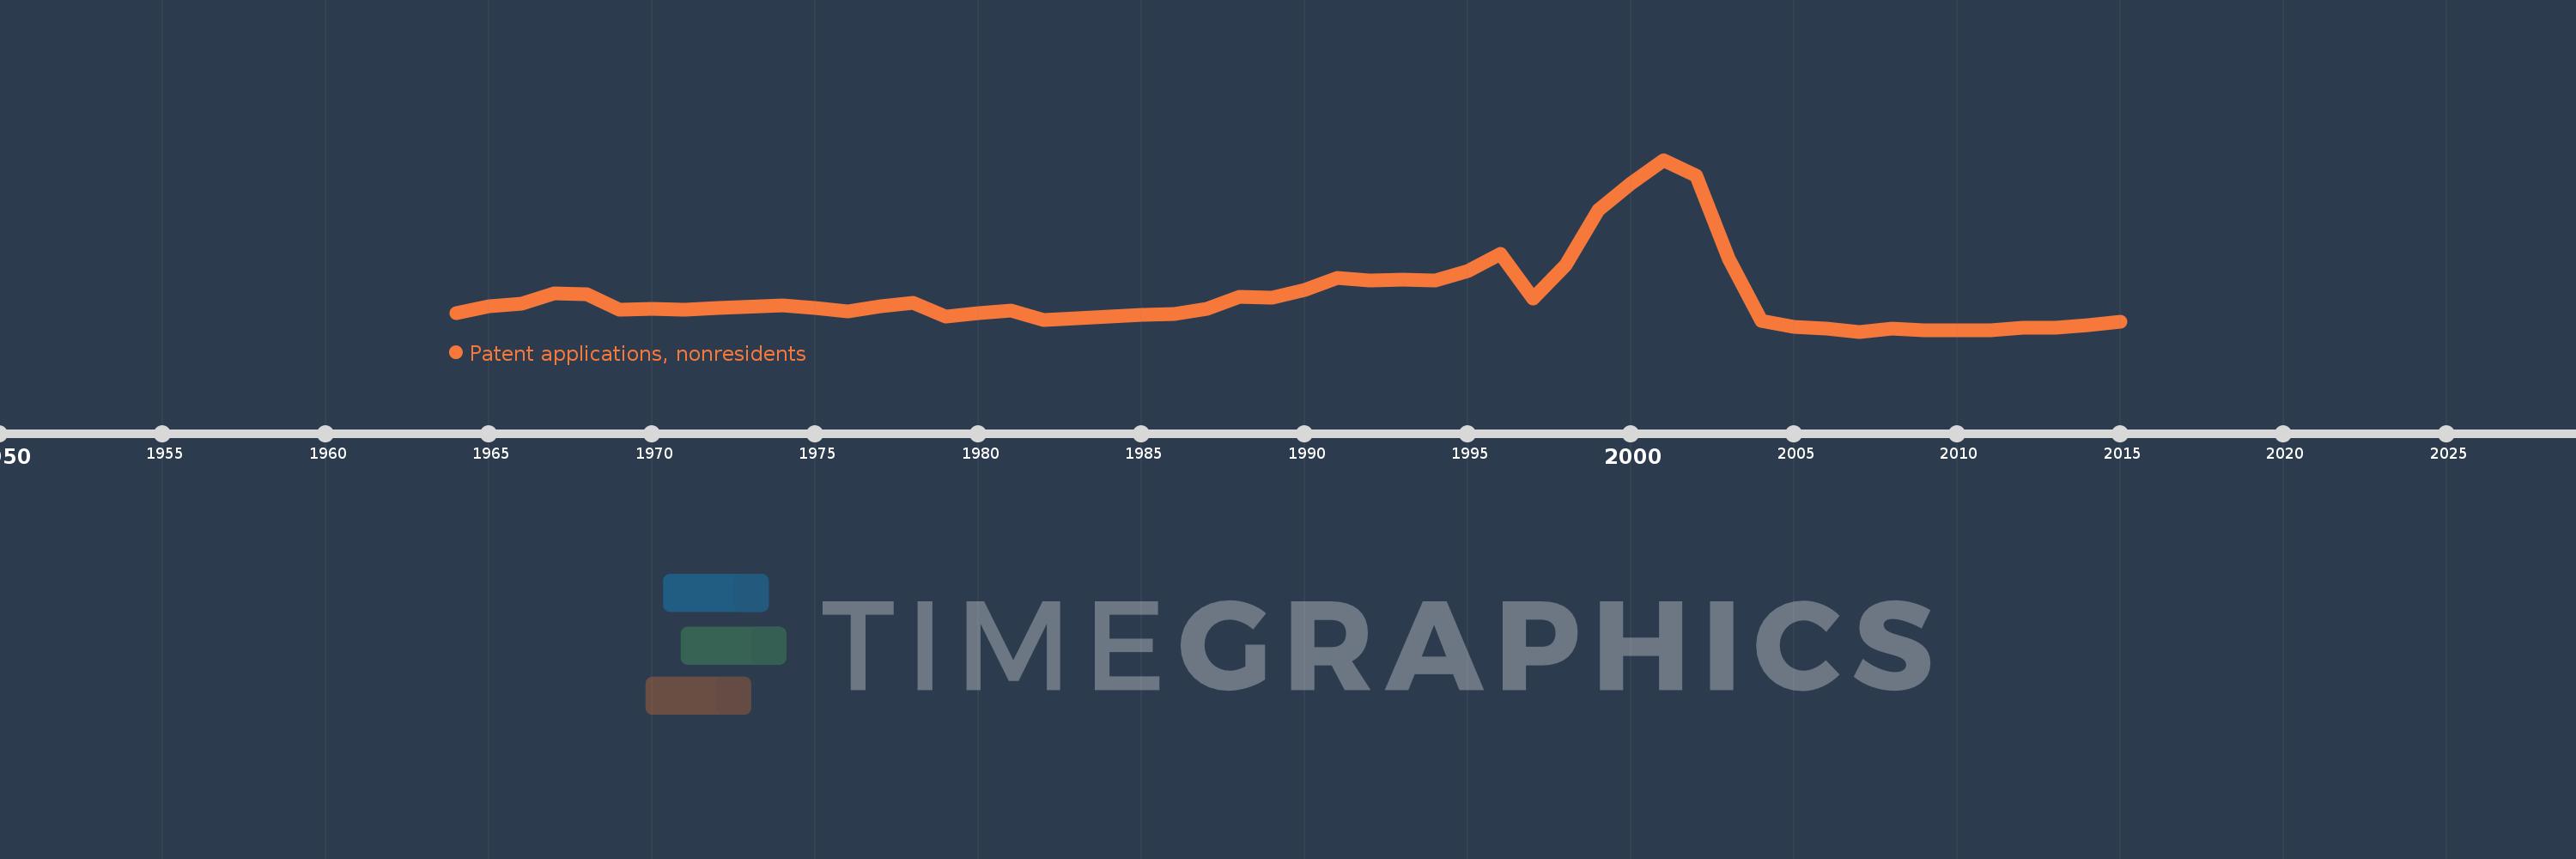
Patent applications, nonresidents
2015,2014,2013,2012,2011,2010,2009,2008,2007,2006,2005,2004,2003,2002,2001,2000,1999,1998,1997,1996,1995,1994,1993,1992,1991,1990,1989,1988,1987,1986,1985,1983,1982,1981,1980,1979,1978,1977,1976,1975,1974,1972,1971,1970,1969,1968,1967,1966,1965,1964
This statistics in other country:
AlbaniaAlgeriaAngolaAntigua and BarbudaArab WorldArgentinaArmeniaAustraliaAustriaAzerbaijanBahamas, TheBahrainBangladeshBarbadosBelarusBelgiumBelizeBhutanBoliviaBosnia and HerzegovinaBotswanaBrazilBrunei DarussalamBulgariaBurundiCambodiaCanadaCaribbean small statesCentral Europe and the BalticsChileChinaColombiaCongo, Dem. Rep.Congo, Rep.Costa RicaCote d'IvoireCroatiaCubaCyprusCzech RepublicDenmarkDjiboutiDominicaDominican RepublicEarly-demographic dividendEast Asia & PacificEast Asia & Pacific (excluding high income)East Asia & Pacific (IDA & IBRD countries)EcuadorEgypt, Arab Rep.El SalvadorEstoniaEthiopiaEuro areaEurope & Central AsiaEurope & Central Asia (excluding high income)Europe & Central Asia (IDA & IBRD countries)European UnionFijiFinlandFranceGambia, TheGeorgiaGermanyGhanaGreeceGrenadaGuatemalaGuyanaHaitiHigh incomeHondurasHong Kong SAR, ChinaHungaryIBRD onlyIcelandIDA & IBRD totalIDA blendIndiaIndonesiaIran, Islamic Rep.IraqIrelandIsraelItalyJamaicaJapanJordanKazakhstanKenyaKiribatiKorea, Dem. People’s Rep.Korea, Rep.KuwaitKyrgyz RepublicLao PDRLate-demographic dividendLatin America & Caribbean Latin America & Caribbean (excluding high income)Latin America & the Caribbean (IDA & IBRD countries)LatviaLebanonLesothoLiberiaLibyaLithuaniaLow & middle incomeLower middle incomeLuxembourgMacao SAR, ChinaMacedonia, FYRMadagascarMalawiMalaysiaMaliMaltaMauritiusMexicoMiddle East & North AfricaMiddle East & North Africa (excluding high income)Middle East & North Africa (IDA & IBRD countries)Middle incomeMoldovaMonacoMongoliaMontenegroMoroccoMozambiqueNamibiaNepalNetherlandsNew ZealandNicaraguaNigeriaNorth AmericaNorwayOECD membersPacific island small statesPakistanPanamaPapua New GuineaParaguayPeruPhilippinesPolandPortugalPost-demographic dividendQatarRomaniaRussian FederationRwandaSamoaSao Tome and PrincipeSaudi ArabiaSerbiaSeychellesSierra LeoneSingaporeSlovak RepublicSloveniaSolomon IslandsSomaliaSouth AfricaSouth AsiaSouth Asia (IDA & IBRD)SpainSri LankaSt. LuciaSt. Vincent and the GrenadinesSudanSwazilandSwedenSwitzerlandSyrian Arab RepublicTajikistanTanzaniaThailandTrinidad and TobagoTunisiaTurkeyTurkmenistanUgandaUkraineUnited Arab EmiratesUnited KingdomUnited StatesUpper middle incomeUruguayUzbekistanVenezuela, RBVietnamWorldYemen, Rep.ZambiaZimbabwe Timeline:
This timeline shows a graph from 1964 to 2015 of Turkey. No data until 1963. Number of actual observations by date: 50.
Source name:
World Development Indicators
Source organization:
World Intellectual Property Organization (WIPO), WIPO Patent Report: Statistics on Worldwide Patent Activity. The International Bureau of WIPO assumes no responsibility with respect to the transformation of these data.
Categories, topics:
Science & Technology
Last updated:
apr 23, 2017
Indicators value changes by year
Maximum:
3.156K
jan 1, 2001
At the date of observation
Value
Absolute change
Change from previous value
jan 1, 1964
484.0
+484.0
0.0%
jan 1, 1965
600.0
+116.0
23.97%
jan 1, 1966
640.0
+40.0
6.67%
jan 1, 1967
832.0
+192.0
30.0%
jan 1, 1968
813.0
-19.0
-2.28%
jan 1, 1969
545.0
-268.0
-32.96%
jan 1, 1970
561.0
+16.0
2.94%
jan 1, 1971
547.0
-14.0
-2.5%
jan 1, 1972
569.0
+22.0
4.02%
jan 1, 1974
610.0
+41.0
7.21%
jan 1, 1975
571.0
-39.0
-6.39%
jan 1, 1976
512.0
-59.0
-10.33%
jan 1, 1977
598.0
+86.0
16.8%
jan 1, 1978
659.0
+61.0
10.2%
jan 1, 1979
429.0
-230.0
-34.9%
jan 1, 1980
485.0
+56.0
13.05%
jan 1, 1981
527.0
+42.0
8.66%
jan 1, 1982
368.0
-159.0
-30.17%
jan 1, 1983
385.0
+17.0
4.62%
jan 1, 1985
447.0
+62.0
16.1%
jan 1, 1986
461.0
+14.0
3.13%
jan 1, 1987
552.0
+91.0
19.74%
jan 1, 1988
760.0
+208.0
37.68%
jan 1, 1989
747.0
-13.0
-1.71%
jan 1, 1990
886.0
+139.0
18.61%
jan 1, 1991
1.09K
+204.0
23.02%
jan 1, 1992
1.057K
-33.0
-3.03%
jan 1, 1993
1.063K
+6.0
0.57%
jan 1, 1994
1.057K
-6.0
-0.56%
jan 1, 1995
1.216K
+159.0
15.04%
jan 1, 1996
1.52K
+304.0
25.0%
jan 1, 1997
735.0
-785.0
-51.64%
jan 1, 1998
1.327K
+592.0
80.54%
jan 1, 1999
2.276K
+949.0
71.51%
jan 1, 2000
2.744K
+468.0
20.56%
jan 1, 2001
3.156K
+412.0
15.01%
jan 1, 2002
2.875K
-281.0
-8.9%
jan 1, 2003
1.424K
-1.451K
-50.47%
jan 1, 2004
348.0
-1.076K
-75.56%
jan 1, 2005
235.0
-113.0
-32.47%
jan 1, 2006
218.0
-17.0
-7.23%
jan 1, 2007
160.0
-58.0
-26.61%
jan 1, 2008
211.0
+51.0
31.88%
jan 1, 2009
176.0
-35.0
-16.59%
jan 1, 2010
177.0
+1.0
0.57%
jan 1, 2011
177.0
0.0
0.0%
jan 1, 2012
228.0
+51.0
28.81%
jan 1, 2013
232.0
+4.0
1.75%
jan 1, 2014
269.0
+37.0
15.95%
jan 1, 2015
331.0
+62.0
23.05%
Ranking of countries by current statistics by years


Comments: