29
/
en
AIzaSyAYiBZKx7MnpbEhh9jyipgxe19OcubqV5w
April 1, 2024
287663
Zimbabwe
ZWE
true
2
1
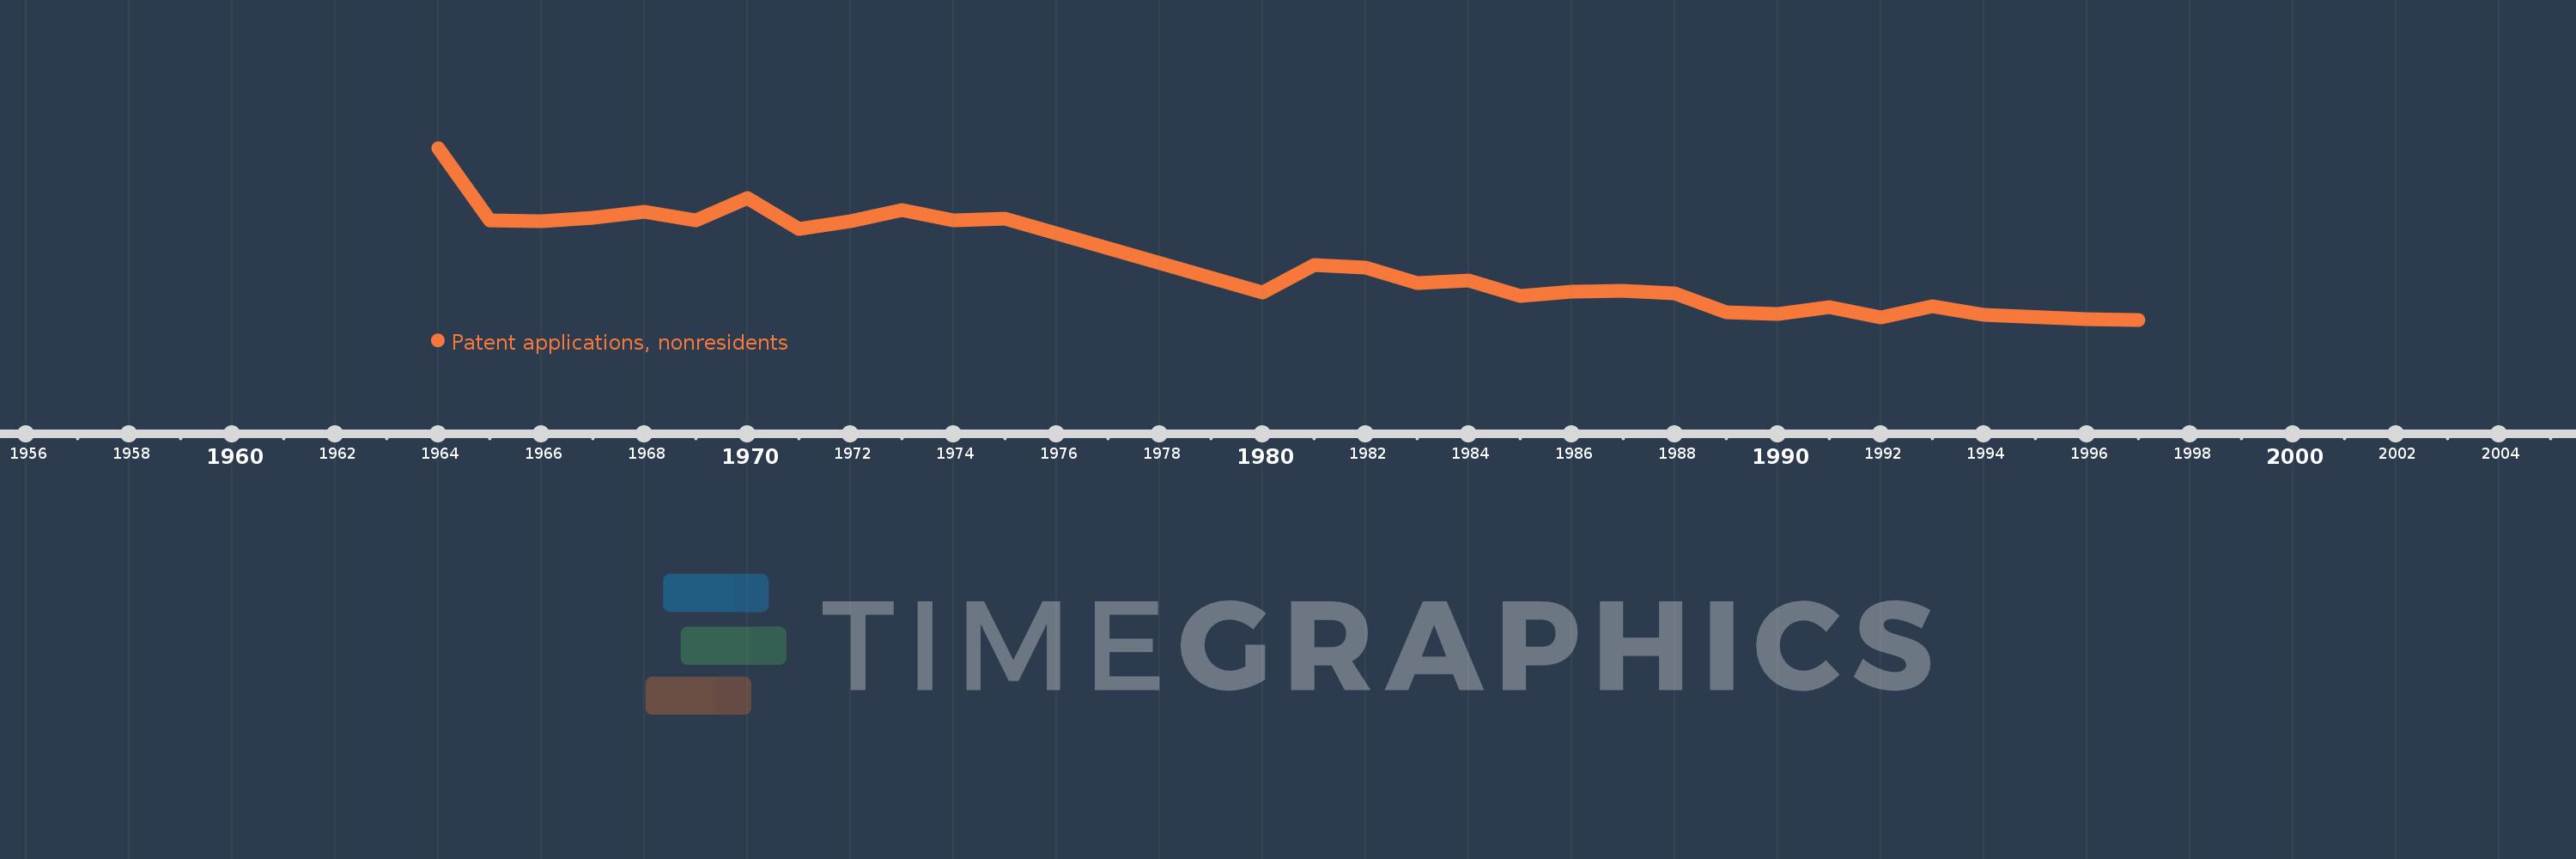
Patent applications, nonresidents
1997,1996,1994,1993,1992,1991,1990,1989,1988,1987,1986,1985,1984,1983,1982,1981,1980,1975,1974,1973,1972,1971,1970,1969,1968,1967,1966,1965,1964
This statistics in other country:
AlbaniaAlgeriaAngolaAntigua and BarbudaArab WorldArgentinaArmeniaAustraliaAustriaAzerbaijanBahamas, TheBahrainBangladeshBarbadosBelarusBelgiumBelizeBhutanBoliviaBosnia and HerzegovinaBotswanaBrazilBrunei DarussalamBulgariaBurundiCambodiaCanadaCaribbean small statesCentral Europe and the BalticsChileChinaColombiaCongo, Dem. Rep.Congo, Rep.Costa RicaCote d'IvoireCroatiaCubaCyprusCzech RepublicDenmarkDjiboutiDominicaDominican RepublicEarly-demographic dividendEast Asia & PacificEast Asia & Pacific (excluding high income)East Asia & Pacific (IDA & IBRD countries)EcuadorEgypt, Arab Rep.El SalvadorEstoniaEthiopiaEuro areaEurope & Central AsiaEurope & Central Asia (excluding high income)Europe & Central Asia (IDA & IBRD countries)European UnionFijiFinlandFranceGambia, TheGeorgiaGermanyGhanaGreeceGrenadaGuatemalaGuyanaHaitiHigh incomeHondurasHong Kong SAR, ChinaHungaryIBRD onlyIcelandIDA & IBRD totalIDA blendIndiaIndonesiaIran, Islamic Rep.IraqIrelandIsraelItalyJamaicaJapanJordanKazakhstanKenyaKiribatiKorea, Dem. People’s Rep.Korea, Rep.KuwaitKyrgyz RepublicLao PDRLate-demographic dividendLatin America & Caribbean Latin America & Caribbean (excluding high income)Latin America & the Caribbean (IDA & IBRD countries)LatviaLebanonLesothoLiberiaLibyaLithuaniaLow & middle incomeLower middle incomeLuxembourgMacao SAR, ChinaMacedonia, FYRMadagascarMalawiMalaysiaMaliMaltaMauritiusMexicoMiddle East & North AfricaMiddle East & North Africa (excluding high income)Middle East & North Africa (IDA & IBRD countries)Middle incomeMoldovaMonacoMongoliaMontenegroMoroccoMozambiqueNamibiaNepalNetherlandsNew ZealandNicaraguaNigeriaNorth AmericaNorwayOECD membersPacific island small statesPakistanPanamaPapua New GuineaParaguayPeruPhilippinesPolandPortugalPost-demographic dividendQatarRomaniaRussian FederationRwandaSamoaSao Tome and PrincipeSaudi ArabiaSerbiaSeychellesSierra LeoneSingaporeSlovak RepublicSloveniaSolomon IslandsSomaliaSouth AfricaSouth AsiaSouth Asia (IDA & IBRD)SpainSri LankaSt. LuciaSt. Vincent and the GrenadinesSudanSwazilandSwedenSwitzerlandSyrian Arab RepublicTajikistanTanzaniaThailandTrinidad and TobagoTunisiaTurkeyTurkmenistanUgandaUkraineUnited Arab EmiratesUnited KingdomUnited StatesUpper middle incomeUruguayUzbekistanVenezuela, RBVietnamWorldYemen, Rep.ZambiaZimbabwe Timeline:
This timeline shows a graph from 1964 to 1997 of Zimbabwe. No data until 1963. Number of actual observations by date: 29.
Source name:
World Development Indicators
Source organization:
World Intellectual Property Organization (WIPO), WIPO Patent Report: Statistics on Worldwide Patent Activity. The International Bureau of WIPO assumes no responsibility with respect to the transformation of these data.
Categories, topics:
Science & Technology
Last updated:
apr 23, 2017
Indicators value changes by year
At the date of observation
Value
Absolute change
Change from previous value
jan 1, 1964
623.0
+623.0
0.0%
jan 1, 1965
412.0
-211.0
-33.87%
jan 1, 1966
409.0
-3.0
-0.73%
jan 1, 1967
420.0
+11.0
2.69%
jan 1, 1968
438.0
+18.0
4.29%
jan 1, 1969
412.0
-26.0
-5.94%
jan 1, 1970
478.0
+66.0
16.02%
jan 1, 1971
386.0
-92.0
-19.25%
jan 1, 1972
409.0
+23.0
5.96%
jan 1, 1973
441.0
+32.0
7.82%
jan 1, 1974
413.0
-28.0
-6.35%
jan 1, 1975
418.0
+5.0
1.21%
jan 1, 1980
201.0
-217.0
-51.91%
jan 1, 1981
281.0
+80.0
39.8%
jan 1, 1982
274.0
-7.0
-2.49%
jan 1, 1983
230.0
-44.0
-16.06%
jan 1, 1984
237.0
+7.0
3.04%
jan 1, 1985
191.0
-46.0
-19.41%
jan 1, 1986
205.0
+14.0
7.33%
jan 1, 1987
206.0
+1.0
0.49%
jan 1, 1988
200.0
-6.0
-2.91%
jan 1, 1989
144.0
-56.0
-28.0%
jan 1, 1990
138.0
-6.0
-4.17%
jan 1, 1991
159.0
+21.0
15.22%
jan 1, 1992
128.0
-31.0
-19.5%
jan 1, 1993
161.0
+33.0
25.78%
jan 1, 1994
136.0
-25.0
-15.53%
jan 1, 1996
125.0
-11.0
-8.09%
jan 1, 1997
122.0
-3.0
-2.4%
Ranking of countries by current statistics by years


Comments: