29
/
en
AIzaSyAYiBZKx7MnpbEhh9jyipgxe19OcubqV5w
April 1, 2024
82104
Belgium
BEL
true
2
1
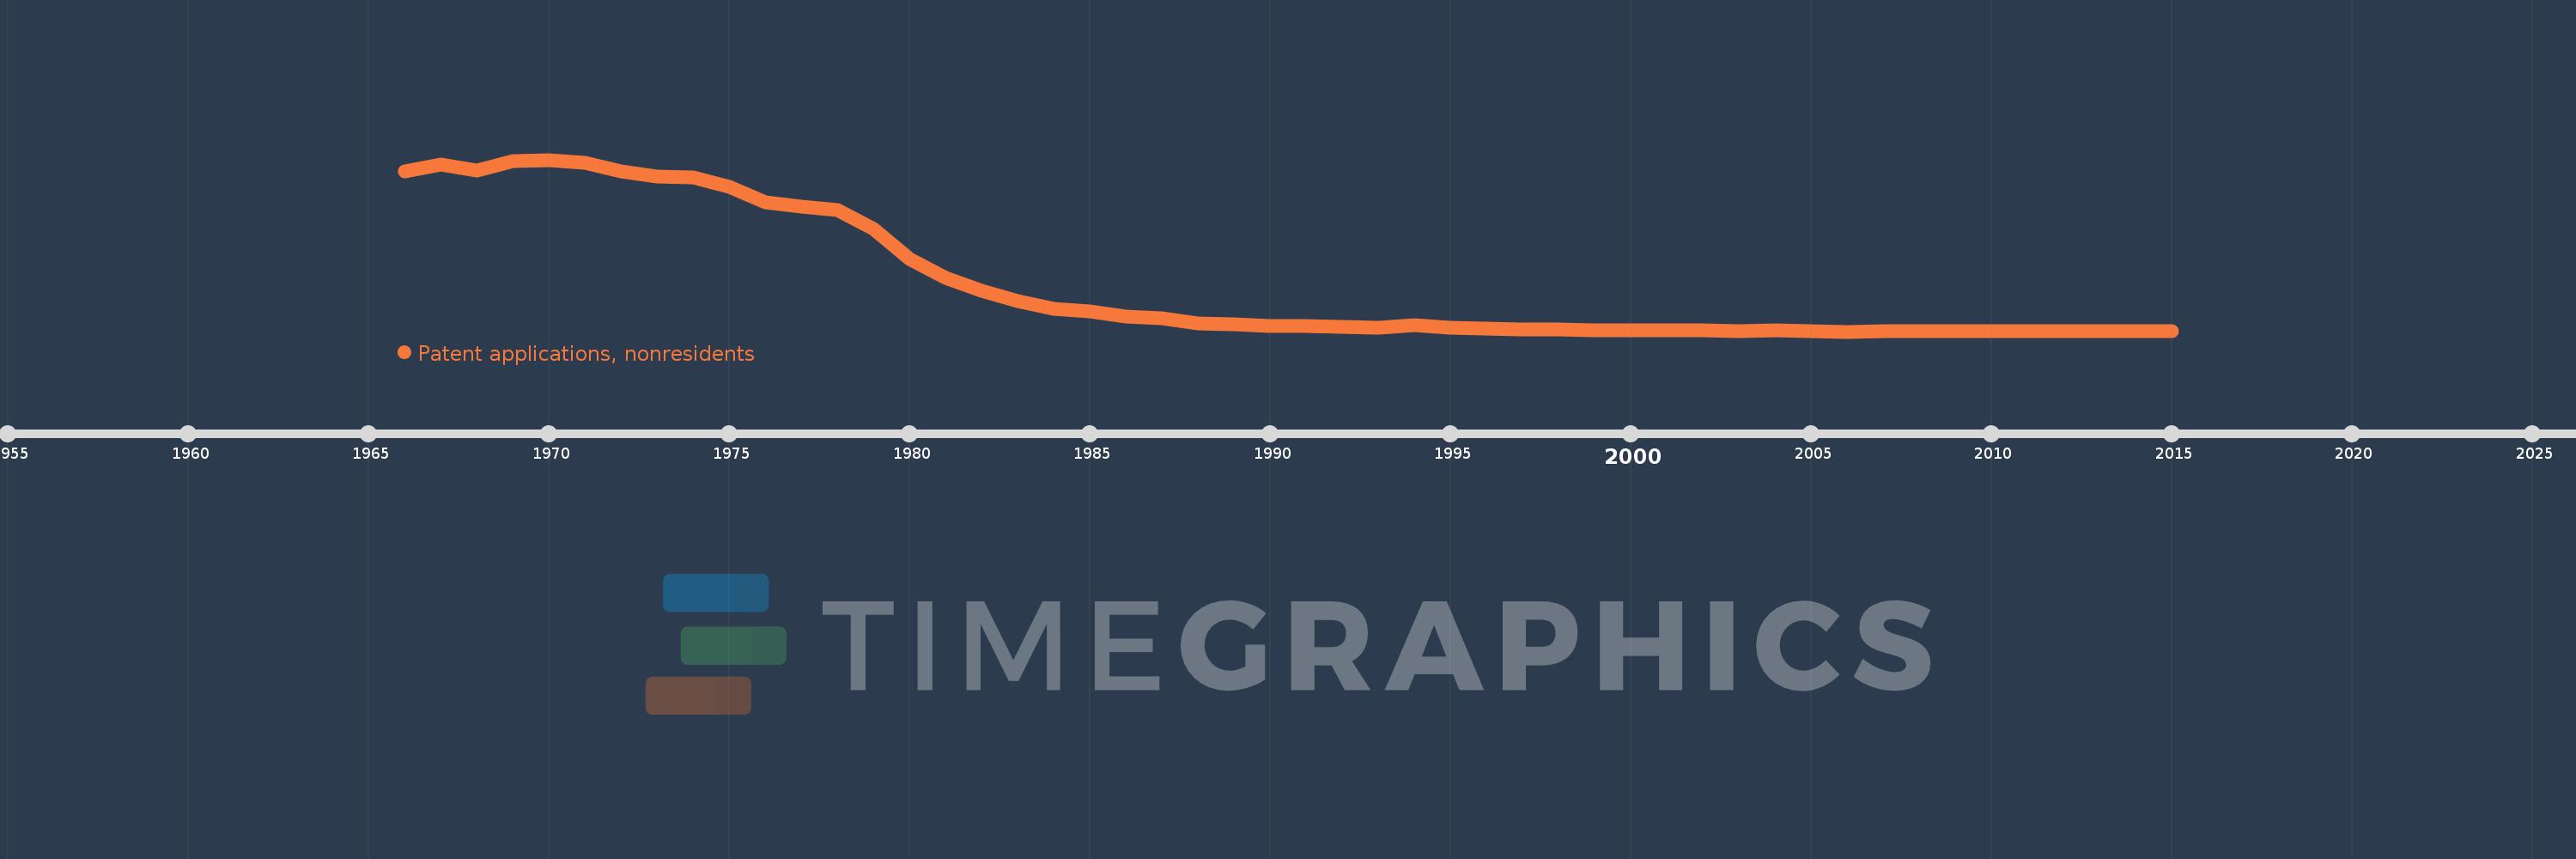
Patent applications, nonresidents
2015,2014,2013,2012,2011,2010,2009,2008,2007,2006,2005,2004,2003,2002,2001,2000,1999,1998,1997,1996,1995,1994,1993,1992,1991,1990,1989,1988,1987,1986,1985,1984,1983,1982,1981,1980,1979,1978,1977,1976,1975,1974,1973,1972,1971,1970,1969,1968,1967,1966
This statistics in other country:
AlbaniaAlgeriaAngolaAntigua and BarbudaArab WorldArgentinaArmeniaAustraliaAustriaAzerbaijanBahamas, TheBahrainBangladeshBarbadosBelarusBelgiumBelizeBhutanBoliviaBosnia and HerzegovinaBotswanaBrazilBrunei DarussalamBulgariaBurundiCambodiaCanadaCaribbean small statesCentral Europe and the BalticsChileChinaColombiaCongo, Dem. Rep.Congo, Rep.Costa RicaCote d'IvoireCroatiaCubaCyprusCzech RepublicDenmarkDjiboutiDominicaDominican RepublicEarly-demographic dividendEast Asia & PacificEast Asia & Pacific (excluding high income)East Asia & Pacific (IDA & IBRD countries)EcuadorEgypt, Arab Rep.El SalvadorEstoniaEthiopiaEuro areaEurope & Central AsiaEurope & Central Asia (excluding high income)Europe & Central Asia (IDA & IBRD countries)European UnionFijiFinlandFranceGambia, TheGeorgiaGermanyGhanaGreeceGrenadaGuatemalaGuyanaHaitiHigh incomeHondurasHong Kong SAR, ChinaHungaryIBRD onlyIcelandIDA & IBRD totalIDA blendIndiaIndonesiaIran, Islamic Rep.IraqIrelandIsraelItalyJamaicaJapanJordanKazakhstanKenyaKiribatiKorea, Dem. People’s Rep.Korea, Rep.KuwaitKyrgyz RepublicLao PDRLate-demographic dividendLatin America & Caribbean Latin America & Caribbean (excluding high income)Latin America & the Caribbean (IDA & IBRD countries)LatviaLebanonLesothoLiberiaLibyaLithuaniaLow & middle incomeLower middle incomeLuxembourgMacao SAR, ChinaMacedonia, FYRMadagascarMalawiMalaysiaMaliMaltaMauritiusMexicoMiddle East & North AfricaMiddle East & North Africa (excluding high income)Middle East & North Africa (IDA & IBRD countries)Middle incomeMoldovaMonacoMongoliaMontenegroMoroccoMozambiqueNamibiaNepalNetherlandsNew ZealandNicaraguaNigeriaNorth AmericaNorwayOECD membersPacific island small statesPakistanPanamaPapua New GuineaParaguayPeruPhilippinesPolandPortugalPost-demographic dividendQatarRomaniaRussian FederationRwandaSamoaSao Tome and PrincipeSaudi ArabiaSerbiaSeychellesSierra LeoneSingaporeSlovak RepublicSloveniaSolomon IslandsSomaliaSouth AfricaSouth AsiaSouth Asia (IDA & IBRD)SpainSri LankaSt. LuciaSt. Vincent and the GrenadinesSudanSwazilandSwedenSwitzerlandSyrian Arab RepublicTajikistanTanzaniaThailandTrinidad and TobagoTunisiaTurkeyTurkmenistanUgandaUkraineUnited Arab EmiratesUnited KingdomUnited StatesUpper middle incomeUruguayUzbekistanVenezuela, RBVietnamWorldYemen, Rep.ZambiaZimbabwe Timeline:
This timeline shows a graph from 1966 to 2015 of Belgium. No data until 1965. Number of actual observations by date: 50.
Source name:
World Development Indicators
Source organization:
World Intellectual Property Organization (WIPO), WIPO Patent Report: Statistics on Worldwide Patent Activity. The International Bureau of WIPO assumes no responsibility with respect to the transformation of these data.
Categories, topics:
Science & Technology
Last updated:
apr 23, 2017
Indicators value changes by year
Maximum:
16.158K
jan 1, 1970
At the date of observation
Value
Absolute change
Change from previous value
jan 1, 1966
15.044K
+15.044K
0.0%
jan 1, 1967
15.744K
+700.0
4.65%
jan 1, 1968
15.152K
-592.0
-3.76%
jan 1, 1969
16.068K
+916.0
6.05%
jan 1, 1970
16.158K
+90.0
0.56%
jan 1, 1971
15.848K
-310.0
-1.92%
jan 1, 1972
15.099K
-749.0
-4.73%
jan 1, 1973
14.62K
-479.0
-3.17%
jan 1, 1974
14.481K
-139.0
-0.95%
jan 1, 1975
13.619K
-862.0
-5.95%
jan 1, 1976
12.164K
-1.455K
-10.68%
jan 1, 1977
11.753K
-411.0
-3.38%
jan 1, 1978
11.453K
-300.0
-2.55%
jan 1, 1979
9.683K
-1.77K
-15.45%
jan 1, 1980
6.864K
-2.819K
-29.11%
jan 1, 1981
5.104K
-1.76K
-25.64%
jan 1, 1982
3.918K
-1.186K
-23.24%
jan 1, 1983
2.944K
-974.0
-24.86%
jan 1, 1984
2.261K
-683.0
-23.2%
jan 1, 1985
1.966K
-295.0
-13.05%
jan 1, 1986
1.476K
-490.0
-24.92%
jan 1, 1987
1.334K
-142.0
-9.62%
jan 1, 1988
889.0
-445.0
-33.36%
jan 1, 1989
776.0
-113.0
-12.71%
jan 1, 1990
663.0
-113.0
-14.56%
jan 1, 1991
613.0
-50.0
-7.54%
jan 1, 1992
574.0
-39.0
-6.36%
jan 1, 1993
499.0
-75.0
-13.07%
jan 1, 1994
679.0
+180.0
36.07%
jan 1, 1995
446.0
-233.0
-34.32%
jan 1, 1996
355.0
-91.0
-20.4%
jan 1, 1997
310.0
-45.0
-12.68%
jan 1, 1998
269.0
-41.0
-13.23%
jan 1, 1999
249.0
-20.0
-7.43%
jan 1, 2000
249.0
0.0
0.0%
jan 1, 2001
243.0
-6.0
-2.41%
jan 1, 2002
264.0
+21.0
8.64%
jan 1, 2003
147.0
-117.0
-44.32%
jan 1, 2004
188.0
+41.0
27.89%
jan 1, 2005
122.0
-66.0
-35.11%
jan 1, 2006
105.0
-17.0
-13.93%
jan 1, 2007
161.0
+56.0
53.33%
jan 1, 2008
163.0
+2.0
1.24%
jan 1, 2009
133.0
-30.0
-18.4%
jan 1, 2010
148.0
+15.0
11.28%
jan 1, 2011
140.0
-8.0
-5.41%
jan 1, 2012
127.0
-13.0
-9.29%
jan 1, 2013
127.0
0.0
0.0%
jan 1, 2014
161.0
+34.0
26.77%
jan 1, 2015
137.0
-24.0
-14.91%
Ranking of countries by current statistics by years


Comments: