29
/
en
AIzaSyAYiBZKx7MnpbEhh9jyipgxe19OcubqV5w
April 1, 2024
59918
Sub-Saharan Africa (excluding high income)
SSA
false
2
1
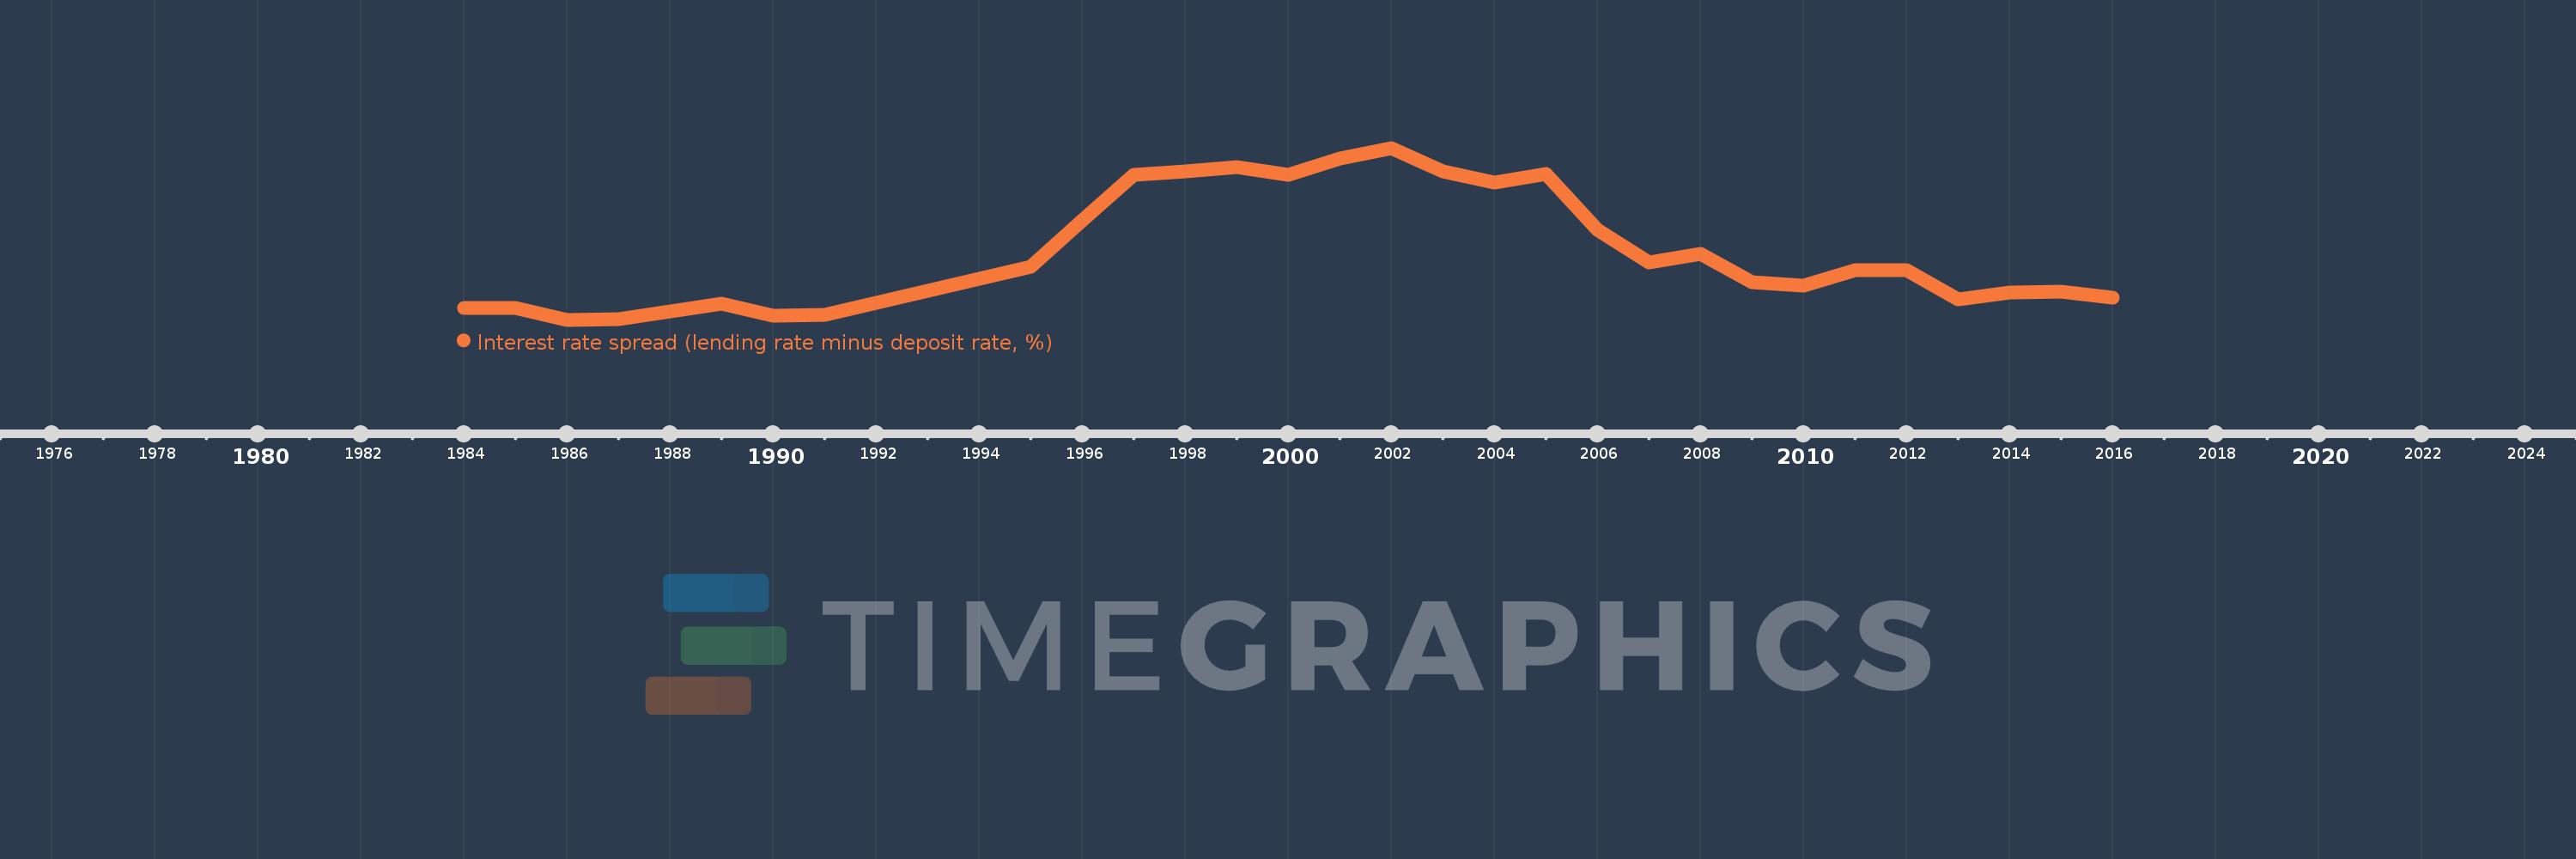
Interest rate spread (lending rate minus deposit rate, %)
2016,2015,2014,2013,2012,2011,2010,2009,2008,2007,2006,2005,2004,2003,2002,2001,2000,1999,1998,1997,1996,1995,1993,1991,1990,1989,1988,1987,1986,1985,1984
This statistics in other country:
AlbaniaAlgeriaAngolaAntigua and BarbudaArab WorldArgentinaArmeniaArubaAustraliaAustriaAzerbaijanBahamas, TheBahrainBangladeshBarbadosBelarusBelgiumBelizeBeninBhutanBoliviaBosnia and HerzegovinaBotswanaBrazilBrunei DarussalamBulgariaBurkina FasoBurundiCabo VerdeCameroonCanadaCaribbean small statesCentral African RepublicCentral Europe and the BalticsChadChileChinaColombiaComorosCongo, Dem. Rep.Congo, Rep.Costa RicaCote d'IvoireCroatiaCyprusCzech RepublicDenmarkDjiboutiDominicaDominican RepublicEarly-demographic dividendEast Asia & PacificEast Asia & Pacific (excluding high income)East Asia & Pacific (IDA & IBRD countries)EcuadorEgypt, Arab Rep.Equatorial GuineaEstoniaEthiopiaEuro areaEurope & Central AsiaEurope & Central Asia (excluding high income)Europe & Central Asia (IDA & IBRD countries)European UnionFijiFinlandFragile and conflict affected situationsFranceGabonGambia, TheGeorgiaGermanyGhanaGreeceGrenadaGuatemalaGuineaGuinea-BissauGuyanaHaitiHeavily indebted poor countries (HIPC)High incomeHondurasHong Kong SAR, ChinaHungaryIBRD onlyIcelandIDA & IBRD totalIDA blendIDA onlyIDA totalIndonesiaIran, Islamic Rep.IraqIrelandIsraelItalyJamaicaJapanJordanKenyaKorea, Rep.KosovoKuwaitKyrgyz RepublicLao PDRLate-demographic dividendLatin America & Caribbean Latin America & Caribbean (excluding high income)Latin America & the Caribbean (IDA & IBRD countries)LatviaLeast developed countries: UN classificationLebanonLesothoLiberiaLibyaLithuaniaLow & middle incomeLow incomeLower middle incomeLuxembourgMacao SAR, ChinaMacedonia, FYRMadagascarMalawiMalaysiaMaldivesMaliMaltaMauritaniaMauritiusMexicoMicronesia, Fed. Sts.Middle East & North AfricaMiddle East & North Africa (excluding high income)Middle East & North Africa (IDA & IBRD countries)Middle incomeMoldovaMongoliaMontenegroMoroccoMozambiqueMyanmarNamibiaNepalNetherlandsNew ZealandNicaraguaNigerNigeriaNorwayOECD membersOmanOther small statesPacific island small statesPanamaPapua New GuineaParaguayPeruPhilippinesPolandPortugalPost-demographic dividendPre-demographic dividendQatarRomaniaRussian FederationRwandaSamoaSan MarinoSao Tome and PrincipeSenegalSerbiaSeychellesSierra LeoneSingaporeSlovak RepublicSloveniaSmall statesSolomon IslandsSouth AfricaSouth AsiaSouth Asia (IDA & IBRD)South SudanSpainSri LankaSt. Kitts and NevisSt. LuciaSt. Vincent and the GrenadinesSub-Saharan Africa Sub-Saharan Africa (excluding high income)Sub-Saharan Africa (IDA & IBRD countries)SurinameSwazilandSwedenSwitzerlandSyrian Arab RepublicTajikistanTanzaniaThailandTimor-LesteTogoTongaTrinidad and TobagoTunisiaUgandaUkraineUnited KingdomUpper middle incomeUruguayVanuatuVenezuela, RBVietnamWest Bank and GazaWorldYemen, Rep.ZambiaZimbabwe Timeline:
This timeline shows a graph from 1984 to 2016 of Sub-Saharan Africa (excluding high income). No data until 1983. Number of actual observations by date: 31.
Source name:
World Development Indicators
Source organization:
International Monetary Fund, International Financial Statistics and data files.
Categories, topics:
Financial Sector
Last updated:
apr 23, 2017
Indicators value changes by year
Maximum:
14.187
jan 1, 2002
At the date of observation
Value
Absolute change
Change from previous value
jan 1, 1984
6.021
+6.021
0.0%
jan 1, 1985
6.0
-0.021
-0.35%
jan 1, 1986
5.417
-0.583
-9.72%
jan 1, 1987
5.458
+0.042
0.77%
jan 1, 1988
5.854
+0.396
7.25%
jan 1, 1989
6.25
+0.396
6.76%
jan 1, 1990
5.633
-0.617
-9.87%
jan 1, 1991
5.688
+0.054
0.96%
jan 1, 1993
6.888
+1.201
21.11%
jan 1, 1995
8.11
+1.222
17.74%
jan 1, 1996
10.5
+2.39
29.47%
jan 1, 1997
12.828
+2.328
22.17%
jan 1, 1998
13.0
+0.172
1.34%
jan 1, 1999
13.188
+0.188
1.44%
jan 1, 2000
12.825
-0.362
-2.75%
jan 1, 2001
13.636
+0.81
6.32%
jan 1, 2002
14.187
+0.551
4.04%
jan 1, 2003
13.0
-1.187
-8.36%
jan 1, 2004
12.44
-0.56
-4.31%
jan 1, 2005
12.854
+0.414
3.33%
jan 1, 2006
10.008
-2.846
-22.14%
jan 1, 2007
8.345
-1.663
-16.62%
jan 1, 2008
8.76
+0.415
4.98%
jan 1, 2009
7.325
-1.435
-16.38%
jan 1, 2010
7.144
-0.181
-2.47%
jan 1, 2011
7.953
+0.809
11.32%
jan 1, 2012
7.96
+0.007
0.08%
jan 1, 2013
6.45
-1.51
-18.96%
jan 1, 2014
6.798
+0.348
5.39%
jan 1, 2015
6.847
+0.049
0.73%
jan 1, 2016
6.553
-0.294
-4.29%
Ranking of countries by current statistics by years


Comments: