29
/
en
AIzaSyAYiBZKx7MnpbEhh9jyipgxe19OcubqV5w
April 1, 2024
134262
France
FRA
true
2
1
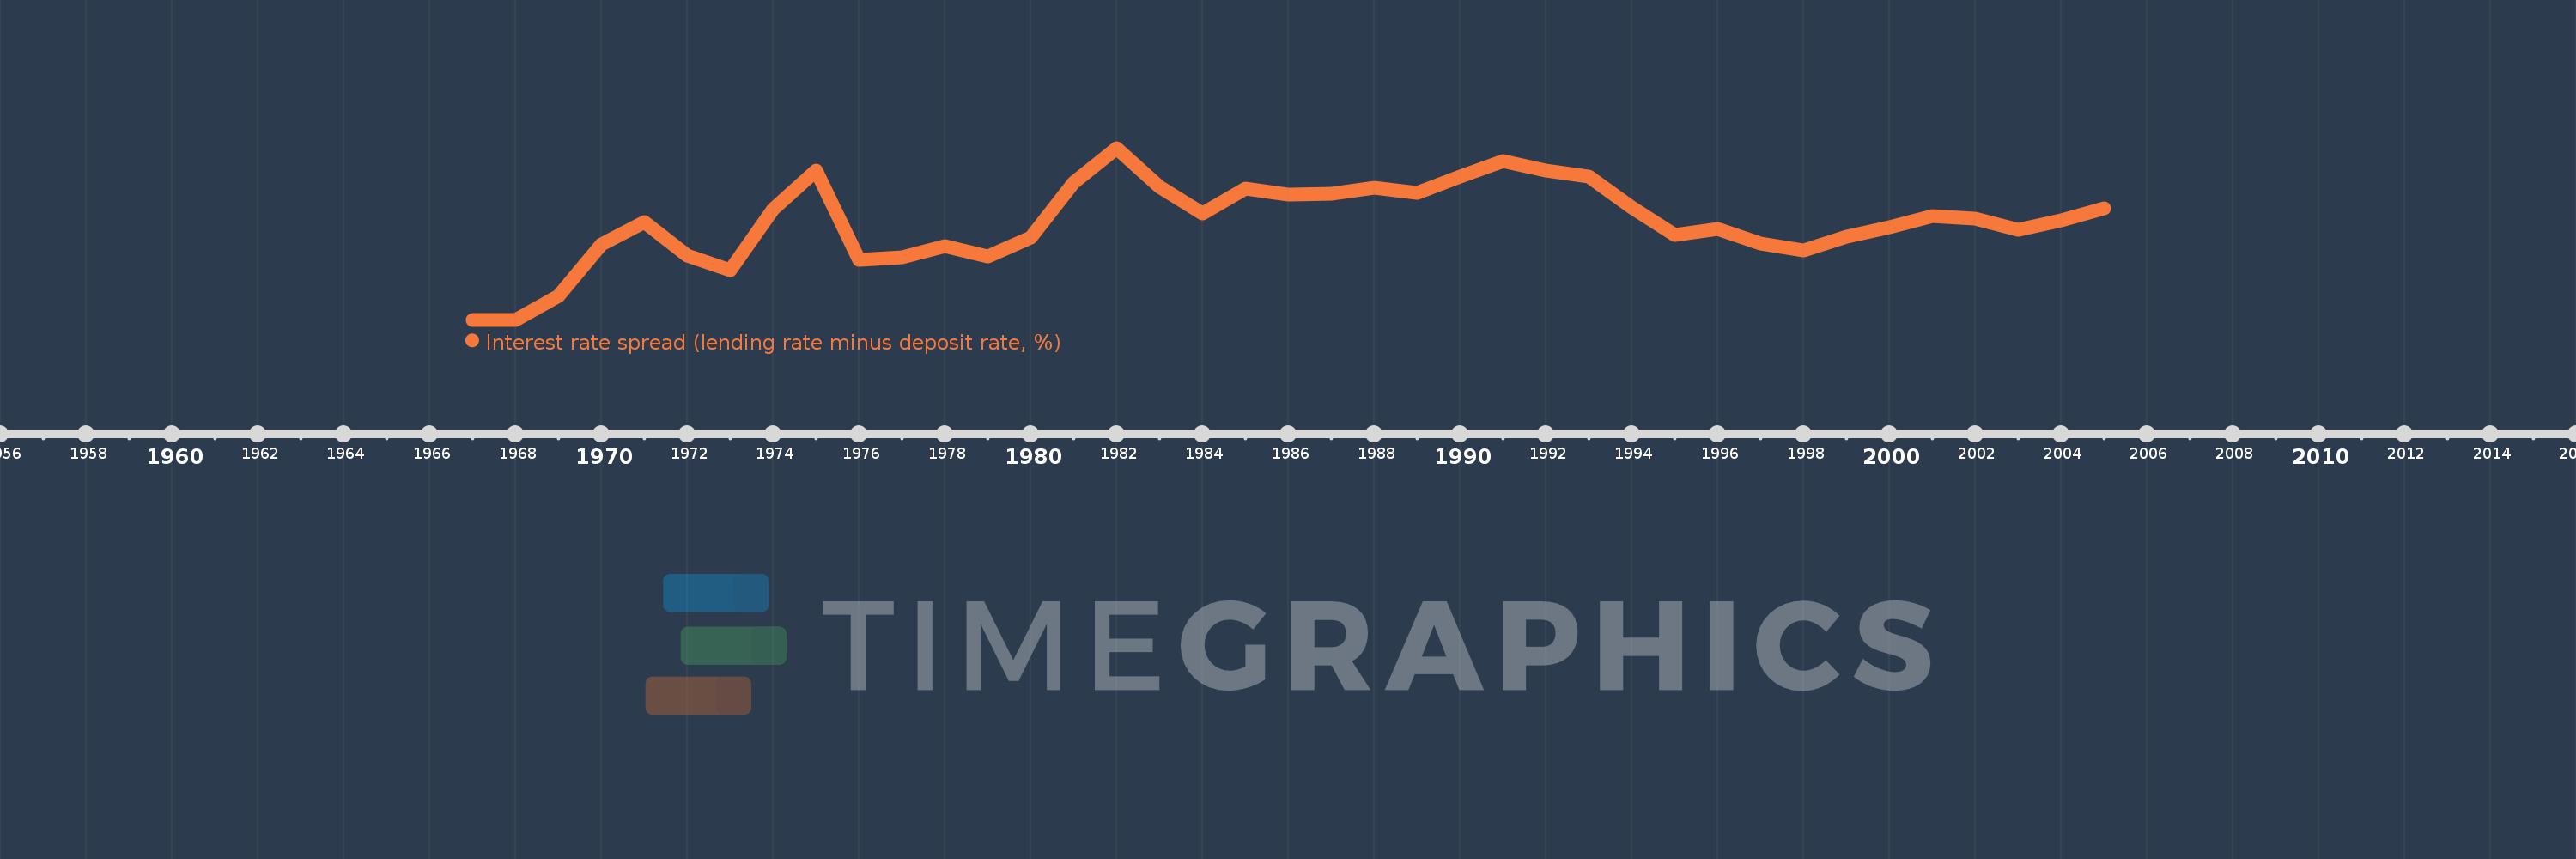
Interest rate spread (lending rate minus deposit rate, %)
2005,2004,2003,2002,2001,2000,1999,1998,1997,1996,1995,1994,1993,1992,1991,1990,1989,1988,1987,1986,1985,1984,1983,1982,1981,1980,1979,1978,1977,1976,1975,1974,1973,1972,1971,1970,1969,1968,1967
This statistics in other country:
AlbaniaAlgeriaAngolaAntigua and BarbudaArab WorldArgentinaArmeniaArubaAustraliaAustriaAzerbaijanBahamas, TheBahrainBangladeshBarbadosBelarusBelgiumBelizeBeninBhutanBoliviaBosnia and HerzegovinaBotswanaBrazilBrunei DarussalamBulgariaBurkina FasoBurundiCabo VerdeCameroonCanadaCaribbean small statesCentral African RepublicCentral Europe and the BalticsChadChileChinaColombiaComorosCongo, Dem. Rep.Congo, Rep.Costa RicaCote d'IvoireCroatiaCyprusCzech RepublicDenmarkDjiboutiDominicaDominican RepublicEarly-demographic dividendEast Asia & PacificEast Asia & Pacific (excluding high income)East Asia & Pacific (IDA & IBRD countries)EcuadorEgypt, Arab Rep.Equatorial GuineaEstoniaEthiopiaEuro areaEurope & Central AsiaEurope & Central Asia (excluding high income)Europe & Central Asia (IDA & IBRD countries)European UnionFijiFinlandFragile and conflict affected situationsFranceGabonGambia, TheGeorgiaGermanyGhanaGreeceGrenadaGuatemalaGuineaGuinea-BissauGuyanaHaitiHeavily indebted poor countries (HIPC)High incomeHondurasHong Kong SAR, ChinaHungaryIBRD onlyIcelandIDA & IBRD totalIDA blendIDA onlyIDA totalIndonesiaIran, Islamic Rep.IraqIrelandIsraelItalyJamaicaJapanJordanKenyaKorea, Rep.KosovoKuwaitKyrgyz RepublicLao PDRLate-demographic dividendLatin America & Caribbean Latin America & Caribbean (excluding high income)Latin America & the Caribbean (IDA & IBRD countries)LatviaLeast developed countries: UN classificationLebanonLesothoLiberiaLibyaLithuaniaLow & middle incomeLow incomeLower middle incomeLuxembourgMacao SAR, ChinaMacedonia, FYRMadagascarMalawiMalaysiaMaldivesMaliMaltaMauritaniaMauritiusMexicoMicronesia, Fed. Sts.Middle East & North AfricaMiddle East & North Africa (excluding high income)Middle East & North Africa (IDA & IBRD countries)Middle incomeMoldovaMongoliaMontenegroMoroccoMozambiqueMyanmarNamibiaNepalNetherlandsNew ZealandNicaraguaNigerNigeriaNorwayOECD membersOmanOther small statesPacific island small statesPanamaPapua New GuineaParaguayPeruPhilippinesPolandPortugalPost-demographic dividendPre-demographic dividendQatarRomaniaRussian FederationRwandaSamoaSan MarinoSao Tome and PrincipeSenegalSerbiaSeychellesSierra LeoneSingaporeSlovak RepublicSloveniaSmall statesSolomon IslandsSouth AfricaSouth AsiaSouth Asia (IDA & IBRD)South SudanSpainSri LankaSt. Kitts and NevisSt. LuciaSt. Vincent and the GrenadinesSub-Saharan Africa Sub-Saharan Africa (excluding high income)Sub-Saharan Africa (IDA & IBRD countries)SurinameSwazilandSwedenSwitzerlandSyrian Arab RepublicTajikistanTanzaniaThailandTimor-LesteTogoTongaTrinidad and TobagoTunisiaUgandaUkraineUnited KingdomUpper middle incomeUruguayVanuatuVenezuela, RBVietnamWest Bank and GazaWorldYemen, Rep.ZambiaZimbabwe Timeline:
This timeline shows a graph from 1967 to 2005 of France. No data until 1966. Number of actual observations by date: 39.
Source name:
World Development Indicators
Source organization:
International Monetary Fund, International Financial Statistics and data files.
Categories, topics:
Financial Sector
Last updated:
apr 23, 2017
Indicators value changes by year
At the date of observation
Value
Absolute change
Change from previous value
jan 1, 1967
0.35
+0.35
0.0%
jan 1, 1969
1.192
+0.842
240.48%
jan 1, 1970
3.075
+1.883
158.04%
jan 1, 1971
3.85
+0.775
25.2%
jan 1, 1972
2.667
-1.183
-30.74%
jan 1, 1973
2.133
-0.533
-20.0%
jan 1, 1974
4.317
+2.183
102.34%
jan 1, 1975
5.733
+1.417
32.82%
jan 1, 1976
2.5
-3.233
-56.4%
jan 1, 1977
2.583
+0.083
3.33%
jan 1, 1978
3.0
+0.417
16.13%
jan 1, 1979
2.617
-0.383
-12.78%
jan 1, 1980
3.313
+0.696
26.59%
jan 1, 1981
5.292
+1.979
59.75%
jan 1, 1982
6.533
+1.242
23.46%
jan 1, 1983
5.125
-1.408
-21.56%
jan 1, 1984
4.167
-0.958
-18.7%
jan 1, 1985
5.062
+0.896
21.5%
jan 1, 1986
4.842
-0.221
-4.36%
jan 1, 1987
4.892
+0.05
1.03%
jan 1, 1988
5.1
+0.208
4.26%
jan 1, 1989
4.925
-0.175
-3.43%
jan 1, 1990
5.5
+0.575
11.68%
jan 1, 1991
6.071
+0.571
10.38%
jan 1, 1992
5.717
-0.354
-5.83%
jan 1, 1993
5.496
-0.221
-3.86%
jan 1, 1994
4.396
-1.1
-20.02%
jan 1, 1995
3.392
-1.004
-22.84%
jan 1, 1996
3.617
+0.225
6.63%
jan 1, 1997
3.1
-0.517
-14.29%
jan 1, 1998
2.842
-0.258
-8.33%
jan 1, 1999
3.342
+0.5
17.6%
jan 1, 2000
3.671
+0.329
9.85%
jan 1, 2001
4.075
+0.404
11.01%
jan 1, 2002
3.975
-0.1
-2.45%
jan 1, 2003
3.6
-0.375
-9.43%
jan 1, 2004
3.913
+0.313
8.68%
jan 1, 2005
4.35
+0.437
11.18%
Ranking of countries by current statistics by years


Comments: