29
/
en
AIzaSyAYiBZKx7MnpbEhh9jyipgxe19OcubqV5w
April 1, 2024
105032
Chile
CHL
true
2
1
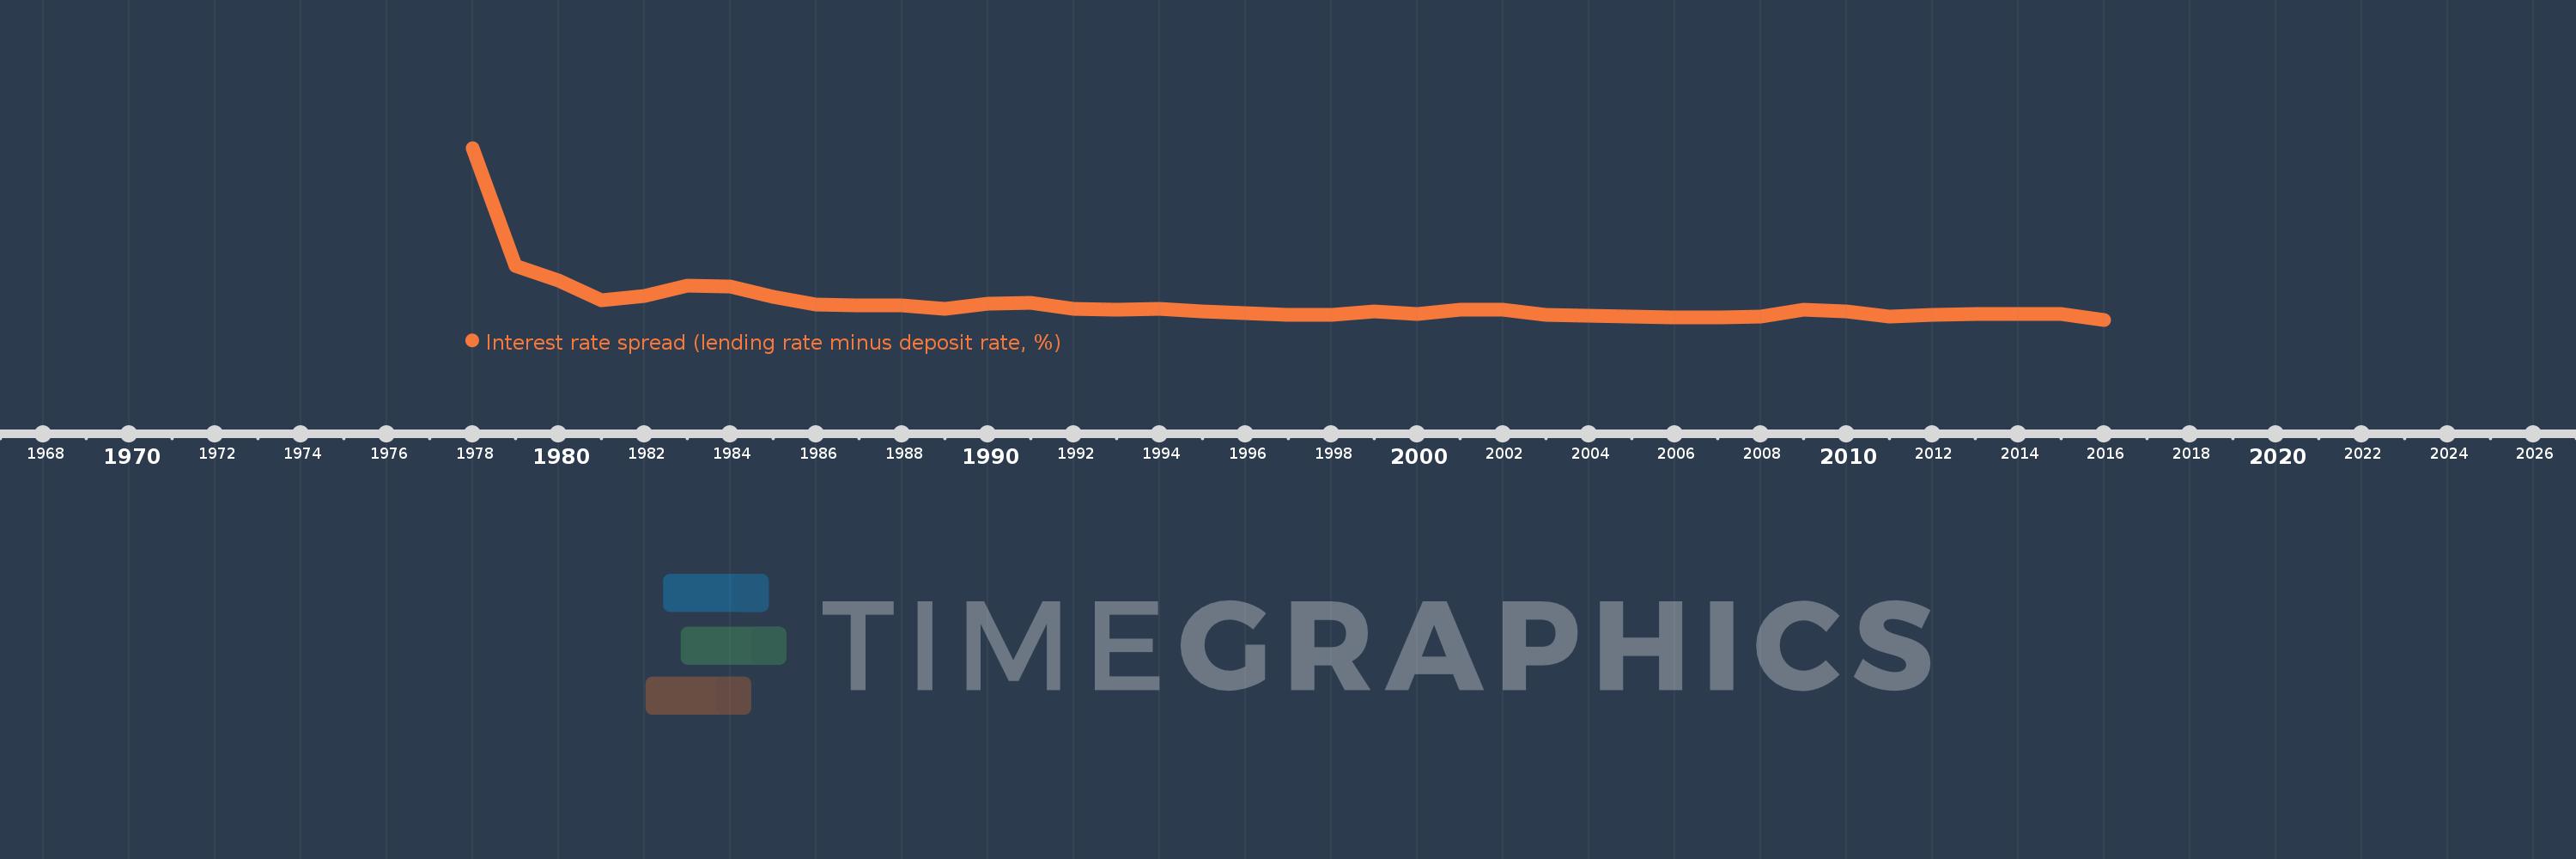
Interest rate spread (lending rate minus deposit rate, %)
2016,2015,2014,2013,2012,2011,2010,2009,2008,2007,2006,2005,2004,2003,2002,2001,2000,1999,1998,1997,1996,1995,1994,1993,1992,1991,1990,1989,1988,1987,1986,1985,1984,1983,1982,1981,1980,1979,1978
This statistics in other country:
AlbaniaAlgeriaAngolaAntigua and BarbudaArab WorldArgentinaArmeniaArubaAustraliaAustriaAzerbaijanBahamas, TheBahrainBangladeshBarbadosBelarusBelgiumBelizeBeninBhutanBoliviaBosnia and HerzegovinaBotswanaBrazilBrunei DarussalamBulgariaBurkina FasoBurundiCabo VerdeCameroonCanadaCaribbean small statesCentral African RepublicCentral Europe and the BalticsChadChileChinaColombiaComorosCongo, Dem. Rep.Congo, Rep.Costa RicaCote d'IvoireCroatiaCyprusCzech RepublicDenmarkDjiboutiDominicaDominican RepublicEarly-demographic dividendEast Asia & PacificEast Asia & Pacific (excluding high income)East Asia & Pacific (IDA & IBRD countries)EcuadorEgypt, Arab Rep.Equatorial GuineaEstoniaEthiopiaEuro areaEurope & Central AsiaEurope & Central Asia (excluding high income)Europe & Central Asia (IDA & IBRD countries)European UnionFijiFinlandFragile and conflict affected situationsFranceGabonGambia, TheGeorgiaGermanyGhanaGreeceGrenadaGuatemalaGuineaGuinea-BissauGuyanaHaitiHeavily indebted poor countries (HIPC)High incomeHondurasHong Kong SAR, ChinaHungaryIBRD onlyIcelandIDA & IBRD totalIDA blendIDA onlyIDA totalIndonesiaIran, Islamic Rep.IraqIrelandIsraelItalyJamaicaJapanJordanKenyaKorea, Rep.KosovoKuwaitKyrgyz RepublicLao PDRLate-demographic dividendLatin America & Caribbean Latin America & Caribbean (excluding high income)Latin America & the Caribbean (IDA & IBRD countries)LatviaLeast developed countries: UN classificationLebanonLesothoLiberiaLibyaLithuaniaLow & middle incomeLow incomeLower middle incomeLuxembourgMacao SAR, ChinaMacedonia, FYRMadagascarMalawiMalaysiaMaldivesMaliMaltaMauritaniaMauritiusMexicoMicronesia, Fed. Sts.Middle East & North AfricaMiddle East & North Africa (excluding high income)Middle East & North Africa (IDA & IBRD countries)Middle incomeMoldovaMongoliaMontenegroMoroccoMozambiqueMyanmarNamibiaNepalNetherlandsNew ZealandNicaraguaNigerNigeriaNorwayOECD membersOmanOther small statesPacific island small statesPanamaPapua New GuineaParaguayPeruPhilippinesPolandPortugalPost-demographic dividendPre-demographic dividendQatarRomaniaRussian FederationRwandaSamoaSan MarinoSao Tome and PrincipeSenegalSerbiaSeychellesSierra LeoneSingaporeSlovak RepublicSloveniaSmall statesSolomon IslandsSouth AfricaSouth AsiaSouth Asia (IDA & IBRD)South SudanSpainSri LankaSt. Kitts and NevisSt. LuciaSt. Vincent and the GrenadinesSub-Saharan Africa Sub-Saharan Africa (excluding high income)Sub-Saharan Africa (IDA & IBRD countries)SurinameSwazilandSwedenSwitzerlandSyrian Arab RepublicTajikistanTanzaniaThailandTimor-LesteTogoTongaTrinidad and TobagoTunisiaUgandaUkraineUnited KingdomUpper middle incomeUruguayVanuatuVenezuela, RBVietnamWest Bank and GazaWorldYemen, Rep.ZambiaZimbabwe Timeline:
This timeline shows a graph from 1978 to 2016 of Chile. No data until 1977. Number of actual observations by date: 39.
Source name:
World Development Indicators
Source organization:
International Monetary Fund, International Financial Statistics and data files.
Categories, topics:
Financial Sector
Last updated:
apr 23, 2017
Indicators value changes by year
Maximum:
68.229
jan 1, 1978
At the date of observation
Value
Absolute change
Change from previous value
jan 1, 1978
68.229
+68.229
0.0%
jan 1, 1979
22.608
-45.622
-66.87%
jan 1, 1980
16.92
-5.688
-25.16%
jan 1, 1981
9.421
-7.499
-44.32%
jan 1, 1982
11.12
+1.7
18.04%
jan 1, 1983
15.187
+4.067
36.57%
jan 1, 1984
14.808
-0.379
-2.5%
jan 1, 1985
10.703
-4.104
-27.72%
jan 1, 1986
7.868
-2.835
-26.49%
jan 1, 1987
7.318
-0.55
-6.98%
jan 1, 1988
7.381
+0.062
0.85%
jan 1, 1989
6.05
-1.331
-18.04%
jan 1, 1990
8.22
+2.171
35.88%
jan 1, 1991
8.515
+0.295
3.59%
jan 1, 1992
6.227
-2.288
-26.87%
jan 1, 1993
5.676
-0.551
-8.85%
jan 1, 1994
6.105
+0.429
7.56%
jan 1, 1995
5.221
-0.884
-14.48%
jan 1, 1996
4.426
-0.795
-15.23%
jan 1, 1997
3.886
-0.54
-12.2%
jan 1, 1998
3.652
-0.234
-6.01%
jan 1, 1999
5.252
+1.599
43.79%
jan 1, 2000
4.063
-1.188
-22.63%
jan 1, 2001
5.642
+1.579
38.87%
jan 1, 2002
5.704
+0.061
1.08%
jan 1, 2003
3.958
-1.745
-30.6%
jan 1, 2004
3.445
-0.513
-12.97%
jan 1, 2005
3.19
-0.255
-7.42%
jan 1, 2006
2.746
-0.444
-13.91%
jan 1, 2007
2.894
+0.148
5.37%
jan 1, 2008
3.061
+0.167
5.79%
jan 1, 2009
5.773
+2.712
88.58%
jan 1, 2010
5.203
-0.57
-9.87%
jan 1, 2011
3.004
-2.199
-42.27%
jan 1, 2012
3.743
+0.74
24.63%
jan 1, 2013
4.269
+0.526
14.04%
jan 1, 2014
4.093
-0.176
-4.12%
jan 1, 2015
4.179
+0.086
2.1%
jan 1, 2016
1.906
-2.273
-54.38%
Ranking of countries by current statistics by years


Comments: