29
/
en
AIzaSyAYiBZKx7MnpbEhh9jyipgxe19OcubqV5w
April 1, 2024
167672
Kenya
KEN
true
2
1
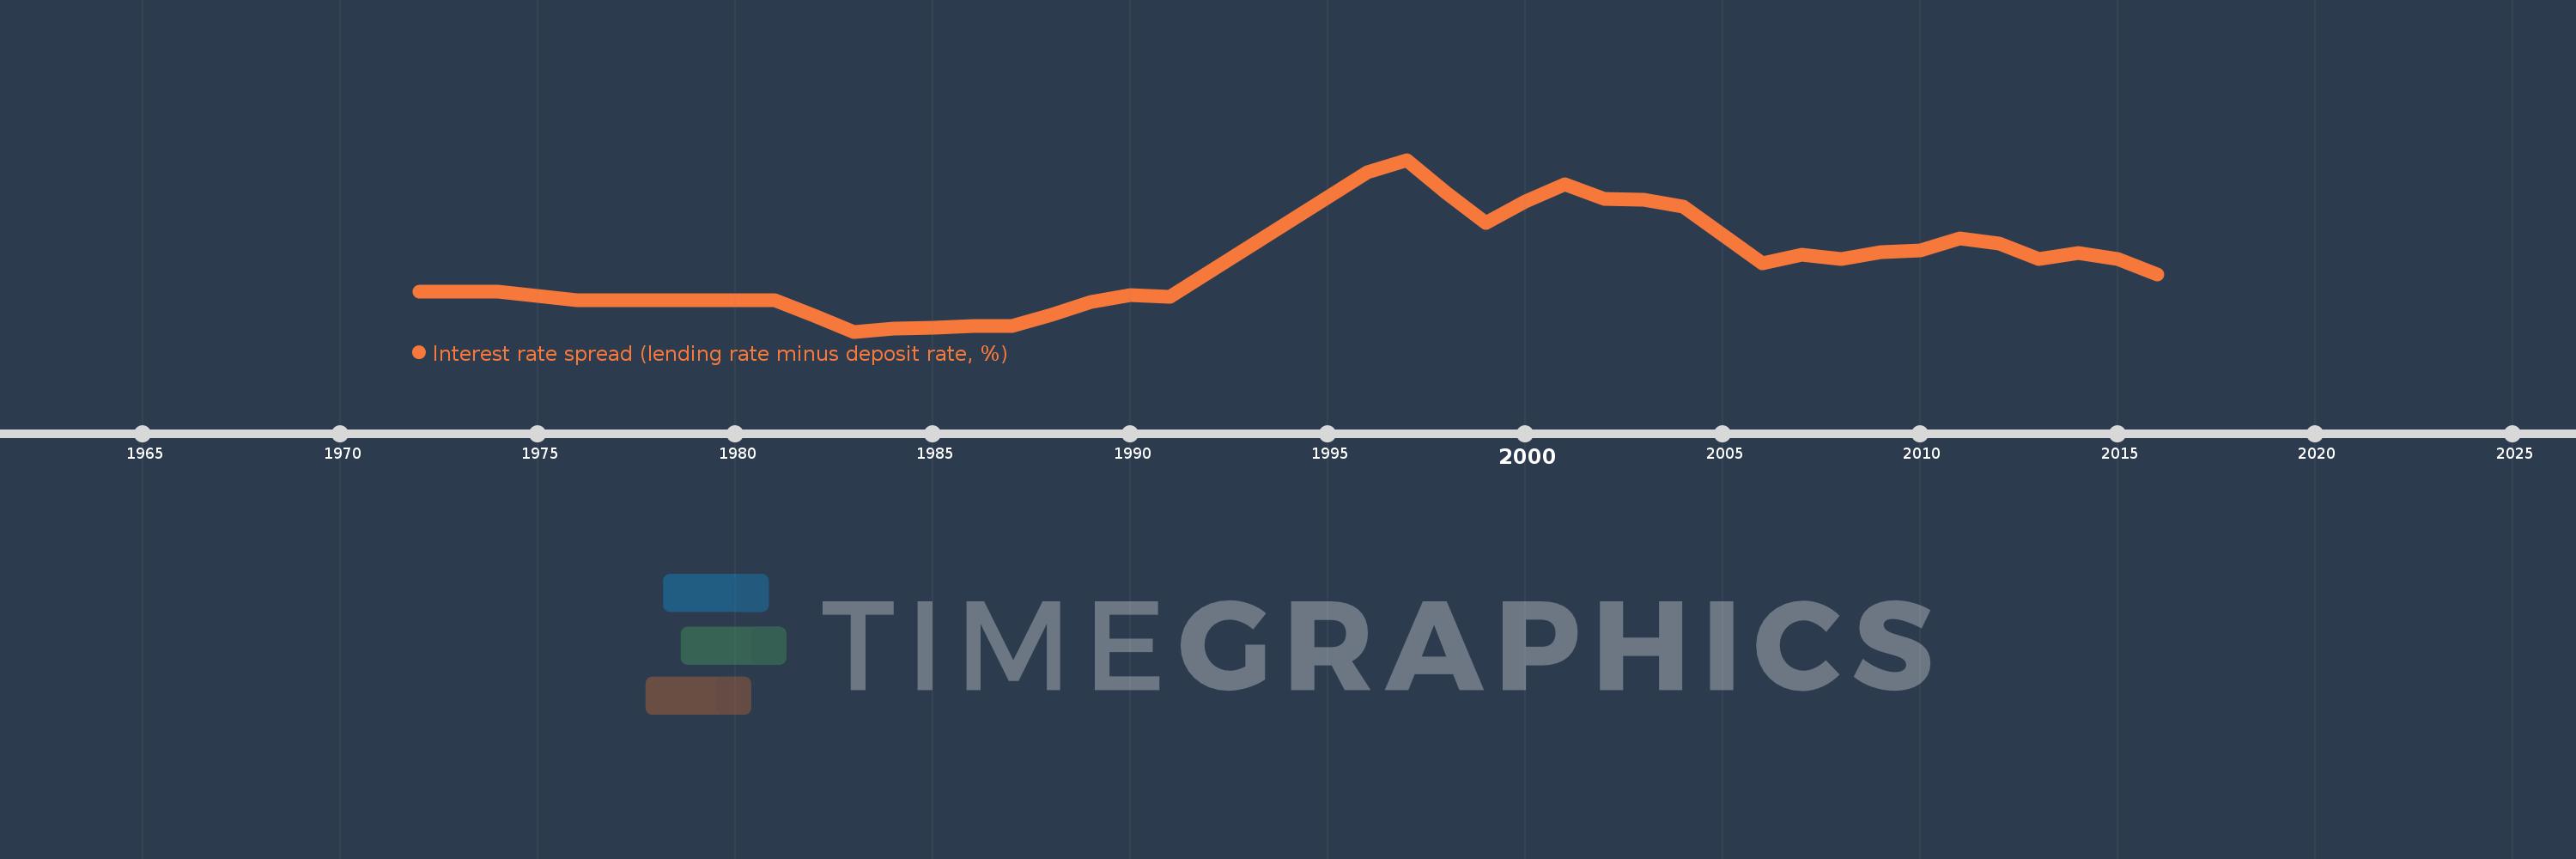
Interest rate spread (lending rate minus deposit rate, %)
2016,2015,2014,2013,2012,2011,2010,2009,2008,2007,2006,2005,2004,2003,2002,2001,2000,1999,1998,1997,1996,1991,1990,1989,1988,1987,1986,1985,1984,1983,1982,1981,1980,1979,1978,1977,1976,1975,1974,1973,1972
This statistics in other country:
AlbaniaAlgeriaAngolaAntigua and BarbudaArab WorldArgentinaArmeniaArubaAustraliaAustriaAzerbaijanBahamas, TheBahrainBangladeshBarbadosBelarusBelgiumBelizeBeninBhutanBoliviaBosnia and HerzegovinaBotswanaBrazilBrunei DarussalamBulgariaBurkina FasoBurundiCabo VerdeCameroonCanadaCaribbean small statesCentral African RepublicCentral Europe and the BalticsChadChileChinaColombiaComorosCongo, Dem. Rep.Congo, Rep.Costa RicaCote d'IvoireCroatiaCyprusCzech RepublicDenmarkDjiboutiDominicaDominican RepublicEarly-demographic dividendEast Asia & PacificEast Asia & Pacific (excluding high income)East Asia & Pacific (IDA & IBRD countries)EcuadorEgypt, Arab Rep.Equatorial GuineaEstoniaEthiopiaEuro areaEurope & Central AsiaEurope & Central Asia (excluding high income)Europe & Central Asia (IDA & IBRD countries)European UnionFijiFinlandFragile and conflict affected situationsFranceGabonGambia, TheGeorgiaGermanyGhanaGreeceGrenadaGuatemalaGuineaGuinea-BissauGuyanaHaitiHeavily indebted poor countries (HIPC)High incomeHondurasHong Kong SAR, ChinaHungaryIBRD onlyIcelandIDA & IBRD totalIDA blendIDA onlyIDA totalIndonesiaIran, Islamic Rep.IraqIrelandIsraelItalyJamaicaJapanJordanKenyaKorea, Rep.KosovoKuwaitKyrgyz RepublicLao PDRLate-demographic dividendLatin America & Caribbean Latin America & Caribbean (excluding high income)Latin America & the Caribbean (IDA & IBRD countries)LatviaLeast developed countries: UN classificationLebanonLesothoLiberiaLibyaLithuaniaLow & middle incomeLow incomeLower middle incomeLuxembourgMacao SAR, ChinaMacedonia, FYRMadagascarMalawiMalaysiaMaldivesMaliMaltaMauritaniaMauritiusMexicoMicronesia, Fed. Sts.Middle East & North AfricaMiddle East & North Africa (excluding high income)Middle East & North Africa (IDA & IBRD countries)Middle incomeMoldovaMongoliaMontenegroMoroccoMozambiqueMyanmarNamibiaNepalNetherlandsNew ZealandNicaraguaNigerNigeriaNorwayOECD membersOmanOther small statesPacific island small statesPanamaPapua New GuineaParaguayPeruPhilippinesPolandPortugalPost-demographic dividendPre-demographic dividendQatarRomaniaRussian FederationRwandaSamoaSan MarinoSao Tome and PrincipeSenegalSerbiaSeychellesSierra LeoneSingaporeSlovak RepublicSloveniaSmall statesSolomon IslandsSouth AfricaSouth AsiaSouth Asia (IDA & IBRD)South SudanSpainSri LankaSt. Kitts and NevisSt. LuciaSt. Vincent and the GrenadinesSub-Saharan Africa Sub-Saharan Africa (excluding high income)Sub-Saharan Africa (IDA & IBRD countries)SurinameSwazilandSwedenSwitzerlandSyrian Arab RepublicTajikistanTanzaniaThailandTimor-LesteTogoTongaTrinidad and TobagoTunisiaUgandaUkraineUnited KingdomUpper middle incomeUruguayVanuatuVenezuela, RBVietnamWest Bank and GazaWorldYemen, Rep.ZambiaZimbabwe Timeline:
This timeline shows a graph from 1972 to 2016 of Kenya. No data until 1971. Number of actual observations by date: 41.
Source name:
World Development Indicators
Source organization:
International Monetary Fund, International Financial Statistics and data files.
Categories, topics:
Financial Sector
Last updated:
apr 23, 2017
Indicators value changes by year
Maximum:
16.196
jan 1, 1997
At the date of observation
Value
Absolute change
Change from previous value
jan 1, 1975
5.185
-0.315
-5.73%
jan 1, 1976
4.87
-0.315
-6.08%
jan 1, 1981
4.83
-0.04
-0.82%
jan 1, 1982
3.57
-1.26
-26.09%
jan 1, 1983
2.303
-1.267
-35.5%
jan 1, 1984
2.563
+0.261
11.33%
jan 1, 1985
2.646
+0.083
3.22%
jan 1, 1986
2.75
+0.104
3.94%
jan 1, 1988
3.688
+0.938
34.09%
jan 1, 1989
4.667
+0.979
26.55%
jan 1, 1990
5.25
+0.583
12.5%
jan 1, 1991
5.083
-0.167
-3.17%
jan 1, 1996
15.198
+10.115
198.98%
jan 1, 1997
16.196
+0.998
6.56%
jan 1, 1998
13.523
-2.673
-16.5%
jan 1, 1999
11.089
-2.434
-18.0%
jan 1, 2000
12.829
+1.74
15.69%
jan 1, 2001
14.238
+1.409
10.98%
jan 1, 2002
13.027
-1.212
-8.51%
jan 1, 2003
12.967
-0.06
-0.46%
jan 1, 2004
12.44
-0.527
-4.06%
jan 1, 2005
10.098
-2.342
-18.82%
jan 1, 2006
7.8
-2.298
-22.76%
jan 1, 2007
8.497
+0.697
8.93%
jan 1, 2008
8.178
-0.319
-3.75%
jan 1, 2009
8.715
+0.537
6.56%
jan 1, 2010
8.838
+0.123
1.41%
jan 1, 2011
9.814
+0.977
11.05%
jan 1, 2012
9.418
-0.396
-4.03%
jan 1, 2013
8.151
-1.267
-13.45%
jan 1, 2014
8.672
+0.52
6.38%
jan 1, 2015
8.141
-0.531
-6.12%
jan 1, 2016
6.898
-1.243
-15.27%
Ranking of countries by current statistics by years


Comments: