29
/
en
AIzaSyAYiBZKx7MnpbEhh9jyipgxe19OcubqV5w
April 1, 2024
243750
Solomon Islands
SLB
true
2
1
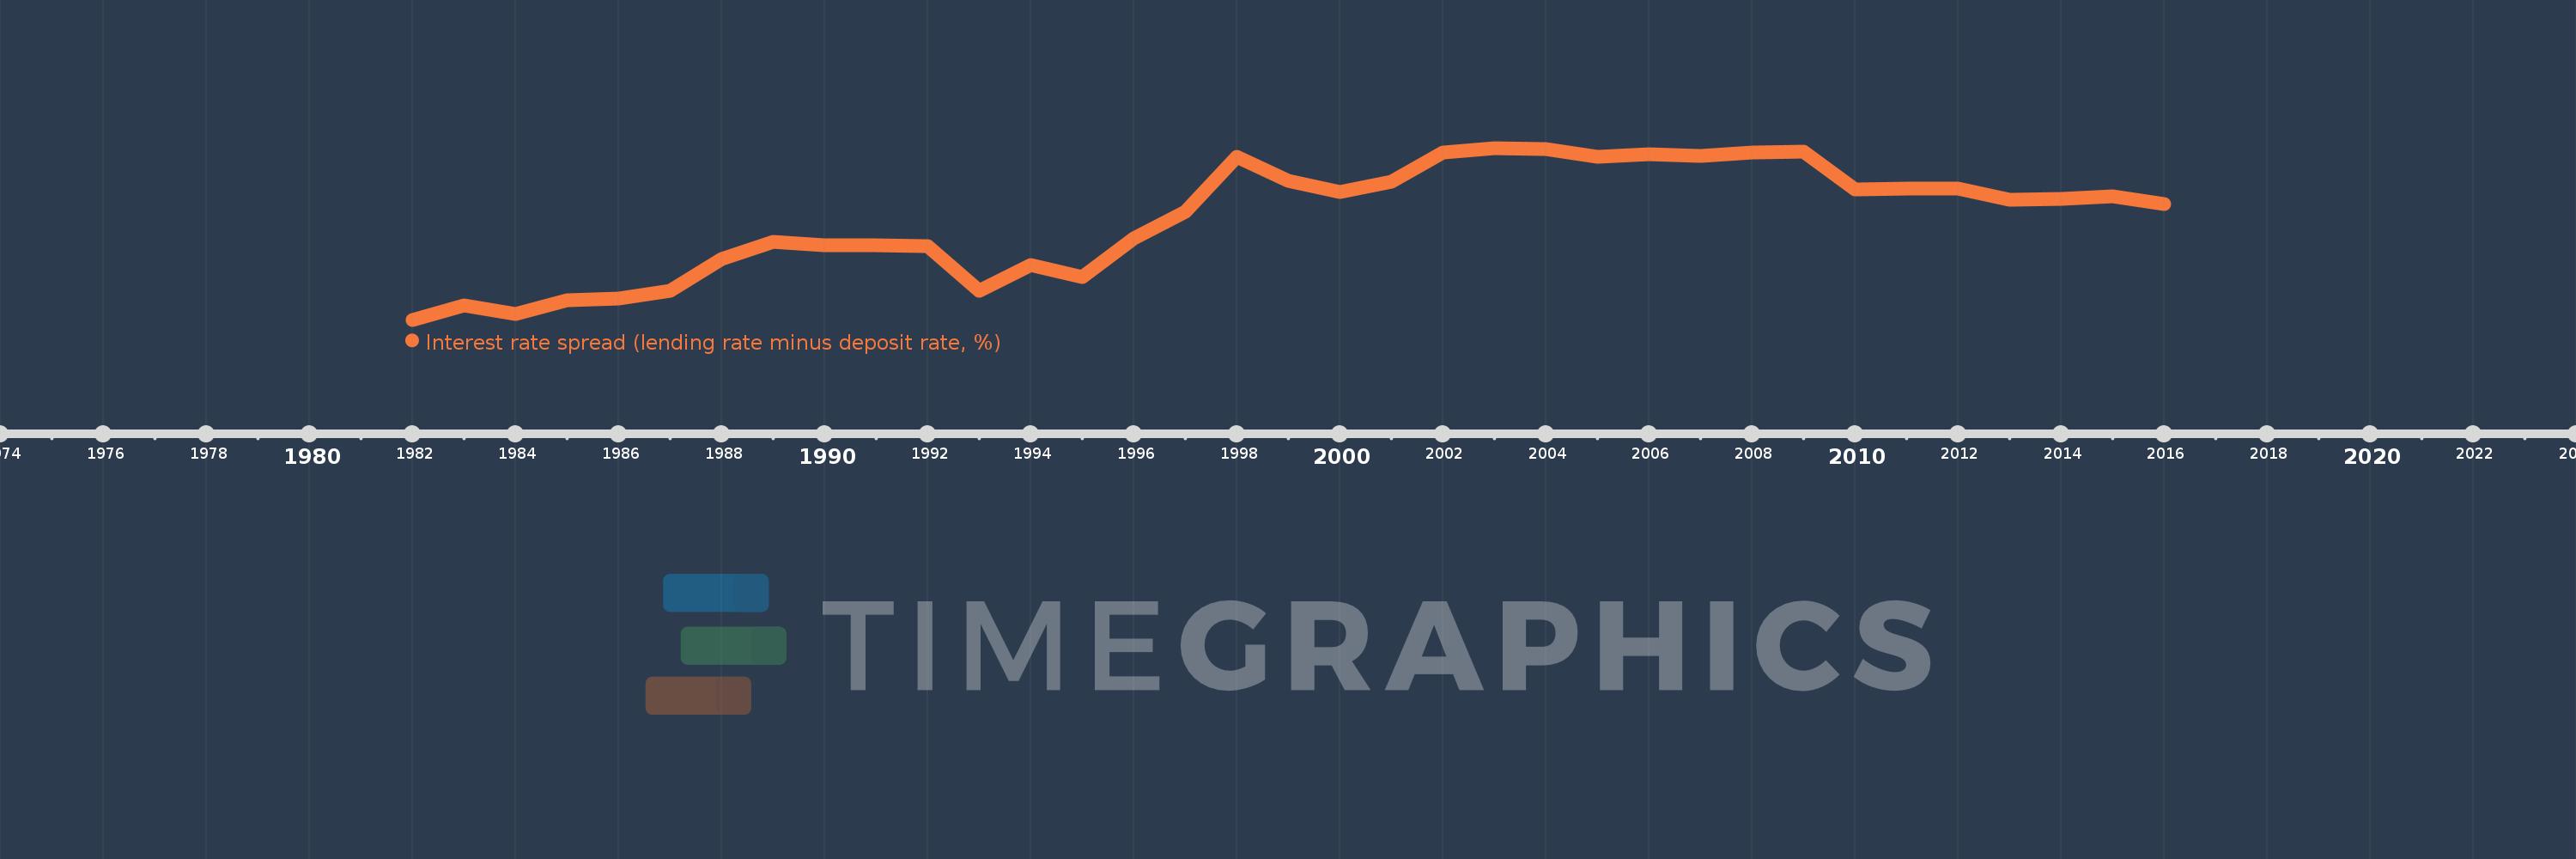
Interest rate spread (lending rate minus deposit rate, %)
2016,2015,2014,2013,2012,2011,2010,2009,2008,2007,2006,2005,2004,2003,2002,2001,2000,1999,1998,1997,1996,1995,1994,1993,1992,1991,1990,1989,1988,1987,1986,1985,1984,1983,1982
This statistics in other country:
AlbaniaAlgeriaAngolaAntigua and BarbudaArab WorldArgentinaArmeniaArubaAustraliaAustriaAzerbaijanBahamas, TheBahrainBangladeshBarbadosBelarusBelgiumBelizeBeninBhutanBoliviaBosnia and HerzegovinaBotswanaBrazilBrunei DarussalamBulgariaBurkina FasoBurundiCabo VerdeCameroonCanadaCaribbean small statesCentral African RepublicCentral Europe and the BalticsChadChileChinaColombiaComorosCongo, Dem. Rep.Congo, Rep.Costa RicaCote d'IvoireCroatiaCyprusCzech RepublicDenmarkDjiboutiDominicaDominican RepublicEarly-demographic dividendEast Asia & PacificEast Asia & Pacific (excluding high income)East Asia & Pacific (IDA & IBRD countries)EcuadorEgypt, Arab Rep.Equatorial GuineaEstoniaEthiopiaEuro areaEurope & Central AsiaEurope & Central Asia (excluding high income)Europe & Central Asia (IDA & IBRD countries)European UnionFijiFinlandFragile and conflict affected situationsFranceGabonGambia, TheGeorgiaGermanyGhanaGreeceGrenadaGuatemalaGuineaGuinea-BissauGuyanaHaitiHeavily indebted poor countries (HIPC)High incomeHondurasHong Kong SAR, ChinaHungaryIBRD onlyIcelandIDA & IBRD totalIDA blendIDA onlyIDA totalIndonesiaIran, Islamic Rep.IraqIrelandIsraelItalyJamaicaJapanJordanKenyaKorea, Rep.KosovoKuwaitKyrgyz RepublicLao PDRLate-demographic dividendLatin America & Caribbean Latin America & Caribbean (excluding high income)Latin America & the Caribbean (IDA & IBRD countries)LatviaLeast developed countries: UN classificationLebanonLesothoLiberiaLibyaLithuaniaLow & middle incomeLow incomeLower middle incomeLuxembourgMacao SAR, ChinaMacedonia, FYRMadagascarMalawiMalaysiaMaldivesMaliMaltaMauritaniaMauritiusMexicoMicronesia, Fed. Sts.Middle East & North AfricaMiddle East & North Africa (excluding high income)Middle East & North Africa (IDA & IBRD countries)Middle incomeMoldovaMongoliaMontenegroMoroccoMozambiqueMyanmarNamibiaNepalNetherlandsNew ZealandNicaraguaNigerNigeriaNorwayOECD membersOmanOther small statesPacific island small statesPanamaPapua New GuineaParaguayPeruPhilippinesPolandPortugalPost-demographic dividendPre-demographic dividendQatarRomaniaRussian FederationRwandaSamoaSan MarinoSao Tome and PrincipeSenegalSerbiaSeychellesSierra LeoneSingaporeSlovak RepublicSloveniaSmall statesSolomon IslandsSouth AfricaSouth AsiaSouth Asia (IDA & IBRD)South SudanSpainSri LankaSt. Kitts and NevisSt. LuciaSt. Vincent and the GrenadinesSub-Saharan Africa Sub-Saharan Africa (excluding high income)Sub-Saharan Africa (IDA & IBRD countries)SurinameSwazilandSwedenSwitzerlandSyrian Arab RepublicTajikistanTanzaniaThailandTimor-LesteTogoTongaTrinidad and TobagoTunisiaUgandaUkraineUnited KingdomUpper middle incomeUruguayVanuatuVenezuela, RBVietnamWest Bank and GazaWorldYemen, Rep.ZambiaZimbabwe Timeline:
This timeline shows a graph from 1982 to 2016 of Solomon Islands. No data until 1981. Number of actual observations by date: 35.
Source name:
World Development Indicators
Source organization:
International Monetary Fund, International Financial Statistics and data files.
Categories, topics:
Financial Sector
Last updated:
apr 23, 2017
Indicators value changes by year
At the date of observation
Value
Absolute change
Change from previous value
jan 1, 1982
2.771
+2.771
0.0%
jan 1, 1983
3.667
+0.896
32.33%
jan 1, 1984
3.125
-0.542
-14.77%
jan 1, 1985
4.0
+0.875
28.0%
jan 1, 1986
4.104
+0.104
2.6%
jan 1, 1987
4.625
+0.521
12.69%
jan 1, 1988
6.667
+2.042
44.14%
jan 1, 1989
7.767
+1.1
16.5%
jan 1, 1990
7.542
-0.225
-2.9%
jan 1, 1991
7.5
-0.042
-0.55%
jan 1, 1992
7.458
-0.042
-0.56%
jan 1, 1993
4.646
-2.813
-37.71%
jan 1, 1994
6.25
+1.604
34.53%
jan 1, 1995
5.5
-0.75
-12.0%
jan 1, 1996
7.966
+2.466
44.83%
jan 1, 1997
9.666
+1.701
21.35%
jan 1, 1998
13.179
+3.513
36.34%
jan 1, 1999
11.666
-1.513
-11.48%
jan 1, 2000
10.913
-0.753
-6.46%
jan 1, 2001
11.569
+0.656
6.01%
jan 1, 2002
13.422
+1.853
16.02%
jan 1, 2003
13.74
+0.318
2.37%
jan 1, 2004
13.668
-0.072
-0.52%
jan 1, 2005
13.193
-0.475
-3.47%
jan 1, 2006
13.361
+0.168
1.27%
jan 1, 2007
13.232
-0.129
-0.96%
jan 1, 2008
13.443
+0.211
1.59%
jan 1, 2009
13.486
+0.043
0.32%
jan 1, 2010
11.117
-2.369
-17.57%
jan 1, 2011
11.146
+0.029
0.26%
jan 1, 2012
11.173
+0.027
0.24%
jan 1, 2013
10.42
-0.753
-6.74%
jan 1, 2014
10.482
+0.063
0.6%
jan 1, 2015
10.664
+0.182
1.73%
jan 1, 2016
10.17
-0.494
-4.64%
Ranking of countries by current statistics by years


Comments: