29
/
en
AIzaSyAYiBZKx7MnpbEhh9jyipgxe19OcubqV5w
April 1, 2024
177830
Lesotho
LSO
true
2
1
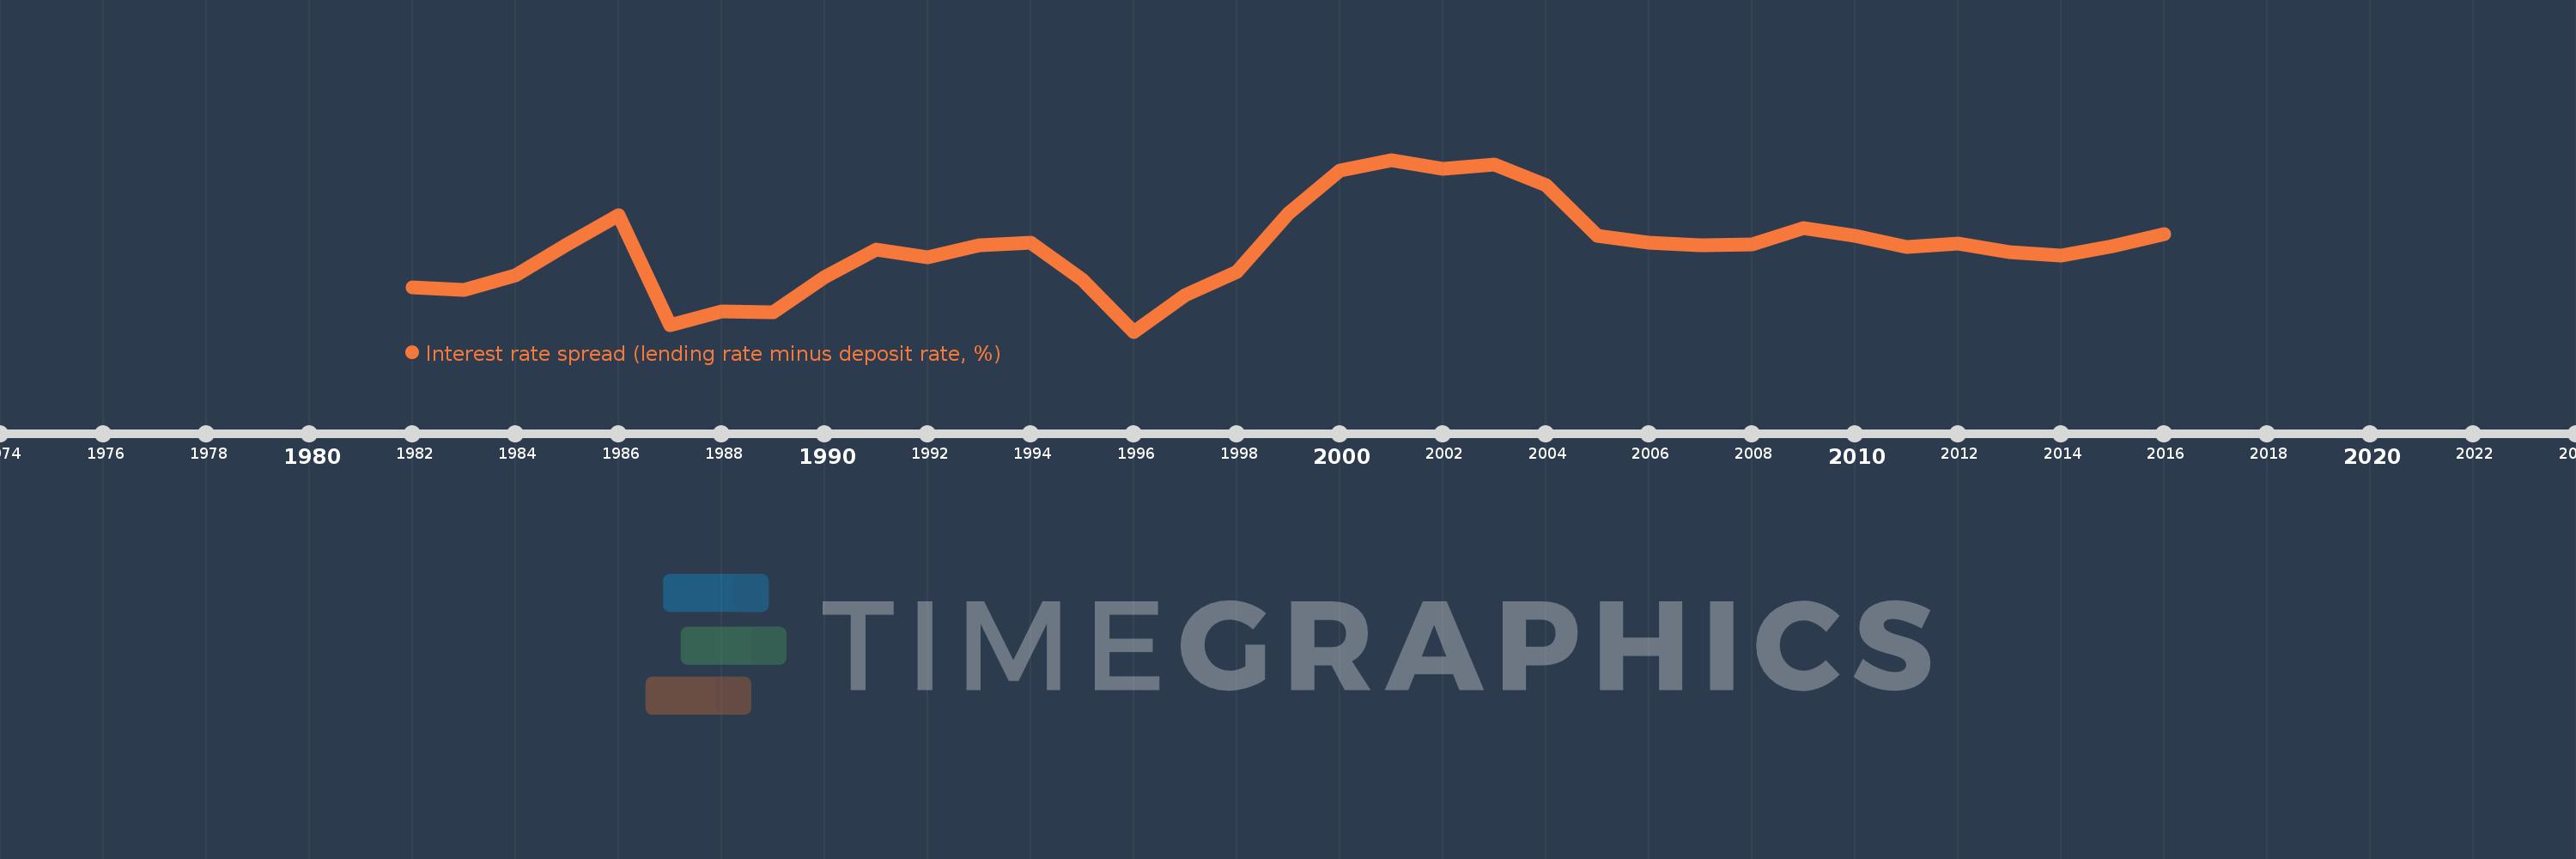
Interest rate spread (lending rate minus deposit rate, %)
2016,2015,2014,2013,2012,2011,2010,2009,2008,2007,2006,2005,2004,2003,2002,2001,2000,1999,1998,1997,1996,1995,1994,1993,1992,1991,1990,1989,1988,1987,1986,1985,1984,1983,1982
This statistics in other country:
AlbaniaAlgeriaAngolaAntigua and BarbudaArab WorldArgentinaArmeniaArubaAustraliaAustriaAzerbaijanBahamas, TheBahrainBangladeshBarbadosBelarusBelgiumBelizeBeninBhutanBoliviaBosnia and HerzegovinaBotswanaBrazilBrunei DarussalamBulgariaBurkina FasoBurundiCabo VerdeCameroonCanadaCaribbean small statesCentral African RepublicCentral Europe and the BalticsChadChileChinaColombiaComorosCongo, Dem. Rep.Congo, Rep.Costa RicaCote d'IvoireCroatiaCyprusCzech RepublicDenmarkDjiboutiDominicaDominican RepublicEarly-demographic dividendEast Asia & PacificEast Asia & Pacific (excluding high income)East Asia & Pacific (IDA & IBRD countries)EcuadorEgypt, Arab Rep.Equatorial GuineaEstoniaEthiopiaEuro areaEurope & Central AsiaEurope & Central Asia (excluding high income)Europe & Central Asia (IDA & IBRD countries)European UnionFijiFinlandFragile and conflict affected situationsFranceGabonGambia, TheGeorgiaGermanyGhanaGreeceGrenadaGuatemalaGuineaGuinea-BissauGuyanaHaitiHeavily indebted poor countries (HIPC)High incomeHondurasHong Kong SAR, ChinaHungaryIBRD onlyIcelandIDA & IBRD totalIDA blendIDA onlyIDA totalIndonesiaIran, Islamic Rep.IraqIrelandIsraelItalyJamaicaJapanJordanKenyaKorea, Rep.KosovoKuwaitKyrgyz RepublicLao PDRLate-demographic dividendLatin America & Caribbean Latin America & Caribbean (excluding high income)Latin America & the Caribbean (IDA & IBRD countries)LatviaLeast developed countries: UN classificationLebanonLesothoLiberiaLibyaLithuaniaLow & middle incomeLow incomeLower middle incomeLuxembourgMacao SAR, ChinaMacedonia, FYRMadagascarMalawiMalaysiaMaldivesMaliMaltaMauritaniaMauritiusMexicoMicronesia, Fed. Sts.Middle East & North AfricaMiddle East & North Africa (excluding high income)Middle East & North Africa (IDA & IBRD countries)Middle incomeMoldovaMongoliaMontenegroMoroccoMozambiqueMyanmarNamibiaNepalNetherlandsNew ZealandNicaraguaNigerNigeriaNorwayOECD membersOmanOther small statesPacific island small statesPanamaPapua New GuineaParaguayPeruPhilippinesPolandPortugalPost-demographic dividendPre-demographic dividendQatarRomaniaRussian FederationRwandaSamoaSan MarinoSao Tome and PrincipeSenegalSerbiaSeychellesSierra LeoneSingaporeSlovak RepublicSloveniaSmall statesSolomon IslandsSouth AfricaSouth AsiaSouth Asia (IDA & IBRD)South SudanSpainSri LankaSt. Kitts and NevisSt. LuciaSt. Vincent and the GrenadinesSub-Saharan Africa Sub-Saharan Africa (excluding high income)Sub-Saharan Africa (IDA & IBRD countries)SurinameSwazilandSwedenSwitzerlandSyrian Arab RepublicTajikistanTanzaniaThailandTimor-LesteTogoTongaTrinidad and TobagoTunisiaUgandaUkraineUnited KingdomUpper middle incomeUruguayVanuatuVenezuela, RBVietnamWest Bank and GazaWorldYemen, Rep.ZambiaZimbabwe Timeline:
This timeline shows a graph from 1982 to 2016 of Lesotho. No data until 1981. Number of actual observations by date: 35.
Source name:
World Development Indicators
Source organization:
International Monetary Fund, International Financial Statistics and data files.
Categories, topics:
Financial Sector
Last updated:
apr 23, 2017
Indicators value changes by year
Maximum:
12.195
jan 1, 2001
At the date of observation
Value
Absolute change
Change from previous value
jan 1, 1982
5.375
+5.375
0.0%
jan 1, 1983
5.25
-0.125
-2.33%
jan 1, 1984
6.042
+0.792
15.08%
jan 1, 1985
7.683
+1.642
27.17%
jan 1, 1986
9.25
+1.567
20.39%
jan 1, 1987
3.375
-5.875
-63.51%
jan 1, 1988
4.125
+0.75
22.22%
jan 1, 1989
4.083
-0.042
-1.01%
jan 1, 1990
5.933
+1.85
45.31%
jan 1, 1991
7.417
+1.483
25.0%
jan 1, 1992
7.0
-0.417
-5.62%
jan 1, 1993
7.625
+0.625
8.93%
jan 1, 1994
7.771
+0.146
1.91%
jan 1, 1995
5.825
-1.946
-25.04%
jan 1, 1996
3.033
-2.792
-47.93%
jan 1, 1997
4.975
+1.942
64.01%
jan 1, 1998
6.221
+1.246
25.04%
jan 1, 1999
9.329
+3.108
49.97%
jan 1, 2000
11.608
+2.279
24.43%
jan 1, 2001
12.195
+0.587
5.05%
jan 1, 2002
11.721
-0.474
-3.89%
jan 1, 2003
11.922
+0.202
1.72%
jan 1, 2004
10.853
-1.069
-8.97%
jan 1, 2005
8.133
-2.72
-25.06%
jan 1, 2006
7.763
-0.371
-4.56%
jan 1, 2007
7.617
-0.145
-1.87%
jan 1, 2008
7.673
+0.056
0.73%
jan 1, 2009
8.545
+0.872
11.36%
jan 1, 2010
8.15
-0.395
-4.63%
jan 1, 2011
7.539
-0.611
-7.49%
jan 1, 2012
7.734
+0.195
2.59%
jan 1, 2013
7.269
-0.465
-6.01%
jan 1, 2014
7.07
-0.199
-2.74%
jan 1, 2015
7.614
+0.544
7.7%
jan 1, 2016
8.255
+0.641
8.41%
Ranking of countries by current statistics by years


Comments: